Reebok 2013 Annual Report Download - page 192
Download and view the complete annual report
Please find page 192 of the 2013 Reebok annual report below. You can navigate through the pages in the report by either clicking on the pages listed below, or by using the keyword search tool below to find specific information within the annual report.-
 1
1 -
2
-
3
-
4
-
5
-
6
-
7
-
8
-
9
-
10
-
11
-
12
-
13
-
14
-
15
-
16
-
17
-
18
-
19
-
20
-
21
-
22
-
23
-
24
-
25
-
26
-
27
-
28
-
29
-
30
-
31
-
32
-
33
-
34
-
35
-
36
-
37
-
38
-
39
-
40
-
41
-
42
-
43
-
44
-
45
-
46
-
47
-
48
-
49
-
50
-
51
-
52
-
53
-
54
-
55
-
56
-
57
-
58
-
59
-
60
-
61
-
62
-
63
-
64
-
65
-
66
-
67
-
68
-
69
-
70
-
71
-
72
-
73
-
74
-
75
-
76
-
77
-
78
-
79
-
80
-
81
-
82
-
83
-
84
-
85
-
86
-
87
-
88
-
89
-
90
-
91
-
92
-
93
-
94
-
95
-
96
-
97
-
98
-
99
-
100
-
101
-
102
-
103
-
104
-
105
-
106
-
107
-
108
-
109
-
110
-
111
-
112
-
113
-
114
-
115
-
116
-
117
-
118
-
119
-
120
-
121
-
122
-
123
-
124
-
125
-
126
-
127
-
128
-
129
-
130
-
131
-
132
-
133
-
134
-
135
-
136
-
137
-
138
-
139
-
140
-
141
-
142
-
143
-
144
-
145
-
146
-
147
-
148
-
149
-
150
-
151
-
152
-
153
-
154
-
155
-
156
-
157
-
158
-
159
-
160
-
161
-
162
-
163
-
164
-
165
-
166
-
167
-
168
-
169
-
170
-
171
-
172
-
173
-
174
-
175
-
176
-
177
-
178
-
179
-
180
-
181
-
 182
182 -
 183
183 -
 184
184 -
 185
185 -
 186
186 -
 187
187 -
 188
188 -
 189
189 -
 190
190 -
 191
191 -
 192
192 -
 193
193 -
 194
194 -
 195
195 -
 196
196 -
 197
197 -
 198
198 -
 199
199 -
 200
200 -
 201
201 -
 202
202 -
203
-
204
-
205
-
206
-
207
-
208
-
209
-
210
-
211
-
212
-
213
-
214
-
215
-
216
-
217
-
218
-
219
-
220
-
221
-
222
-
223
-
224
-
225
-
226
-
227
-
228
-
229
-
230
-
231
-
232
-
233
-
234
-
235
-
236
-
237
-
238
-
239
-
240
-
241
-
242
-
243
-
244
-
245
-
246
-
247
-
248
-
249
-
250
-
251
-
252
-
253
-
254
-
255
-
256
-
257
-
258
-
259
-
260
-
261
-
262
-
263
-
264
 |
 |
4
adidas Group
/
2013 Annual Report
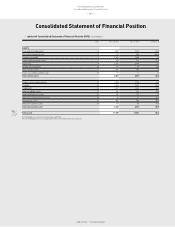
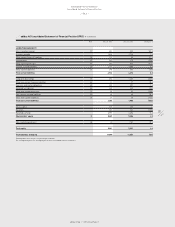
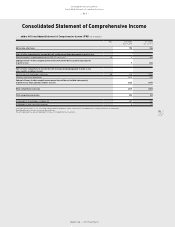
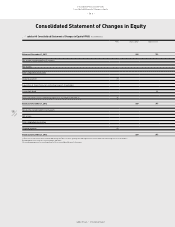
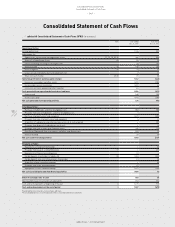
Consolidated Financial Statements
188
2013
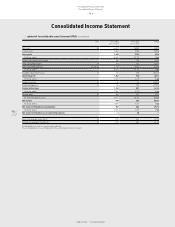
Consolidated Income Statement
/
04.4
/
..
/
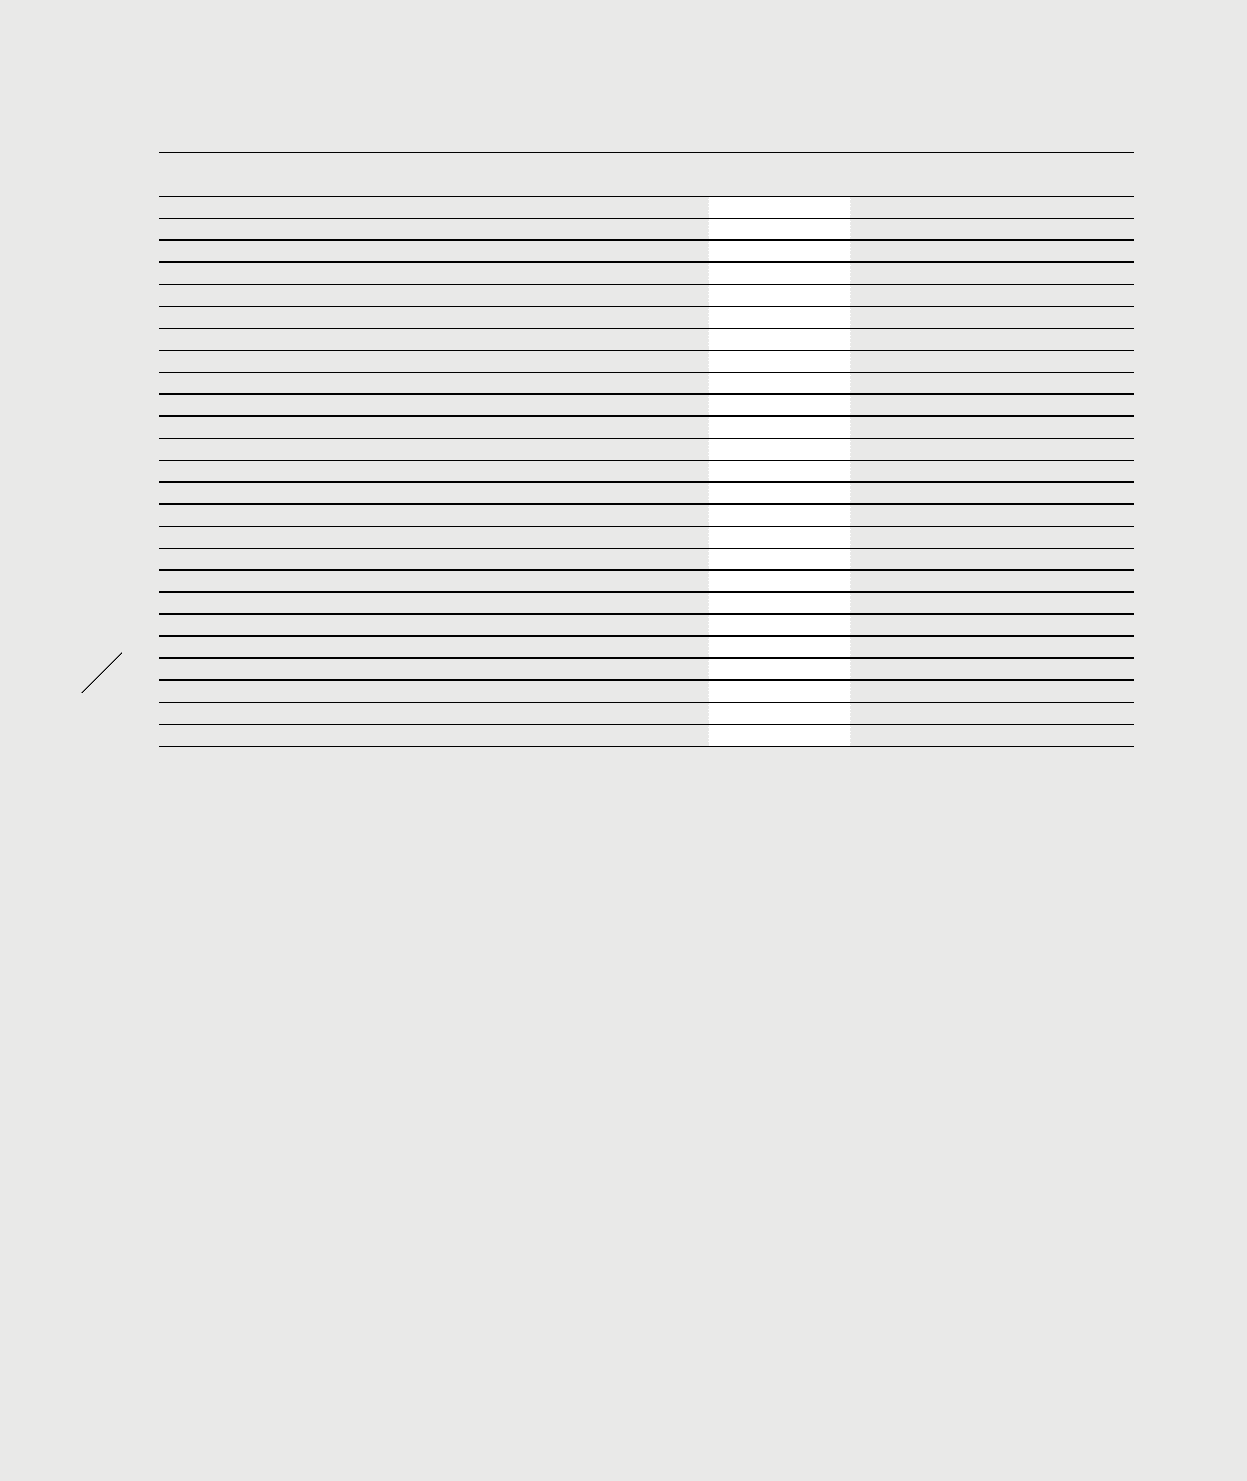
adidas AG Consolidated Income Statement (IFRS) (€ in millions)
Note Year ending
Dec. 31, 2013
Year ending
Dec. 31, 2012
Change
Net sales 35 14,492 14,883 (2.6%)
Cost of sales 7,352 7,780 (5.5%)
Gross profit 7,140 7,103 0.5%
(% of net sales) 49.3% 47.7% 1.5pp
Royalty and commission income 104 105 (1.2%)
Other operating income 29 143 127 12.8%
Other operating expenses 11, 13, 30 6,133 6,150 (0.3%)
(% of net sales) 42.3% 41.3% 1.0pp
Goodwill impairment losses 12 52 265 (80.2%)
Operating profit 1,202 920 30.6%
(% of net sales) 8.3% 6.2% 2.1pp
Financial income 32 26 36 (28.2%)
Financial expenses 32 94 105 (11.2%)
Income before taxes 1,134 851 33.3%
(% of net sales) 7.8% 5.7% 2.1pp
Income taxes 33 344 327 5.3%
(% of income before taxes) 30.4% 38.4% (8.0pp)
Net income 790 524 50.7%
(% of net sales) 5.4% 3.5% 1.9pp
Net income attributable to shareholders 787 526 49.3%
(% of net sales) 5.4% 3.5% 1.9pp
Net income attributable to non-controlling interests 3 (2) —
Basic earnings per share (in €) 34 3.76 2.52 49.3%
Diluted earnings per share (in €) 34 3.76 2.52 49.3%
Rounding differences may arise in percentages and totals.
The accompanying notes are an integral part of these consolidated financial statements.
Consolidated Income Statement