Reebok 2013 Annual Report Download - page 202
Download and view the complete annual report
Please find page 202 of the 2013 Reebok annual report below. You can navigate through the pages in the report by either clicking on the pages listed below, or by using the keyword search tool below to find specific information within the annual report.-
 1
1 -
2
-
3
-
4
-
5
-
6
-
7
-
8
-
9
-
10
-
11
-
12
-
13
-
14
-
15
-
16
-
17
-
18
-
19
-
20
-
21
-
22
-
23
-
24
-
25
-
26
-
27
-
28
-
29
-
30
-
31
-
32
-
33
-
34
-
35
-
36
-
37
-
38
-
39
-
40
-
41
-
42
-
43
-
44
-
45
-
46
-
47
-
48
-
49
-
50
-
51
-
52
-
53
-
54
-
55
-
56
-
57
-
58
-
59
-
60
-
61
-
62
-
63
-
64
-
65
-
66
-
67
-
68
-
69
-
70
-
71
-
72
-
73
-
74
-
75
-
76
-
77
-
78
-
79
-
80
-
81
-
82
-
83
-
84
-
85
-
86
-
87
-
88
-
89
-
90
-
91
-
92
-
93
-
94
-
95
-
96
-
97
-
98
-
99
-
100
-
101
-
102
-
103
-
104
-
105
-
106
-
107
-
108
-
109
-
110
-
111
-
112
-
113
-
114
-
115
-
116
-
117
-
118
-
119
-
120
-
121
-
122
-
123
-
124
-
125
-
126
-
127
-
128
-
129
-
130
-
131
-
132
-
133
-
134
-
135
-
136
-
137
-
138
-
139
-
140
-
141
-
142
-
143
-
144
-
145
-
146
-
147
-
148
-
149
-
150
-
151
-
152
-
153
-
154
-
155
-
156
-
157
-
158
-
159
-
160
-
161
-
162
-
163
-
164
-
165
-
166
-
167
-
168
-
169
-
170
-
171
-
172
-
173
-
174
-
175
-
176
-
177
-
178
-
179
-
180
-
181
-
182
-
183
-
184
-
185
-
186
-
187
-
188
-
189
-
190
-
191
-
 192
192 -
 193
193 -
 194
194 -
 195
195 -
 196
196 -
 197
197 -
 198
198 -
 199
199 -
 200
200 -
 201
201 -
 202
202 -
 203
203 -
 204
204 -
 205
205 -
 206
206 -
 207
207 -
 208
208 -
 209
209 -
 210
210 -
 211
211 -
 212
212 -
213
-
214
-
215
-
216
-
217
-
218
-
219
-
220
-
221
-
222
-
223
-
224
-
225
-
226
-
227
-
228
-
229
-
230
-
231
-
232
-
233
-
234
-
235
-
236
-
237
-
238
-
239
-
240
-
241
-
242
-
243
-
244
-
245
-
246
-
247
-
248
-
249
-
250
-
251
-
252
-
253
-
254
-
255
-
256
-
257
-
258
-
259
-
260
-
261
-
262
-
263
-
264
 |
 |

adidas Group
/
2013 Annual Report
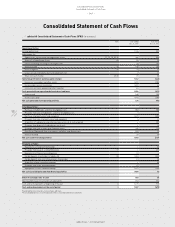
Consolidated Financial Statements
198
2013
Notes
/
04.8
/
Cash and cash equivalents
Cash and cash equivalents represent cash at banks, cash on hand and short-term deposits with maturities of
three months or less from the date of acquisition.
Cash equivalents are short-term, highly liquid investments that are readily convertible to known amounts of
cash and which are subject to an insignificant risk of changes in value.
Receivables and other financial assets
Receivables and other financial assets are recognised at fair value, which corresponds to the nominal value for
current receivables and other financial assets. For non-current receivables and other financial assets, the fair
value is estimated as the present value of future cash flows discounted at the market rate of interest at the
balance sheet date. Subsequently, these are measured at amortised cost using the “effective interest method”.
Required allowances, if necessary, are determined on the basis of individual risk assessments, and on the ageing
structure of receivables past due.
Inventories
Merchandise and finished goods are valued at the lower of cost or net realisable value, which is the estimated
selling price in the ordinary course of business less the estimated costs of completion and the estimated costs
necessary to make the sale. Costs are determined using a standard valuation method: the “average cost method”.
Costs of finished goods include cost of raw materials, direct labour and the components of the manufacturing
overheads which can reasonably be attributed. The allocation of overheads is based on the planned average
utilisation. The net realisable value allowances are computed consistently throughout the Group based on the age
and expected future sales of the items on hand.
Assets/liabilities classified as held for sale
Assets/liabilities classified as held for sale are primarily non-current assets and liabilities expected to be
recovered principally through sale rather than through continuing use. These are measured at the lower of their
carrying amount and fair value less costs to sell. Assets classified as held for sale are not depreciated on a
straight-line basis.
Property, plant and equipment
Property, plant and equipment are measured at amortised cost. This comprises any costs directly attributable
to bringing the asset to the condition necessary for it to be capable of operating in the manner intended by
Management less accumulated depreciation (except for land and construction in progress) and accumulated
impairment losses. Depreciation is recognised over the estimated useful life utilising the “straight-line method”
and taking into account any potential residual value, except where the “declining-balance method” is more
appropriate in light of the actual utilisation pattern. Parts of an item of property, plant and equipment with a cost
that is significant in relation to the total cost of the item are depreciated separately.
Land leases are measured at the lower of the fair value or the present value of minimum lease payments and
are depreciated on a straight-line basis over the contractually agreed lease term.
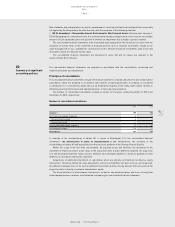
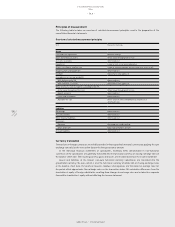
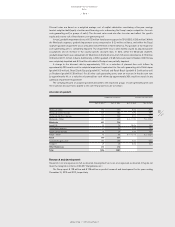
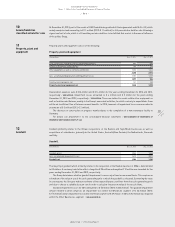
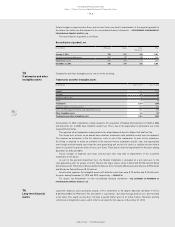
Estimated useful lives are as follows:
Estimated useful lives of property, plant and equipment
Years
Land leases 99
Buildings and leasehold improvements 20 – 50 1)
Technical equipment and machinery as well as other equipment and furniture and fixtures 2 – 10
1) Or, if shorter, the lease term/useful life, see Note 27.
Expenditures for repairs and maintenance are expensed as incurred. Renewals and improvements are capitalised
and depreciated separately, if the recognition criteria are met.