Reebok 2013 Annual Report Download - page 36
Download and view the complete annual report
Please find page 36 of the 2013 Reebok annual report below. You can navigate through the pages in the report by either clicking on the pages listed below, or by using the keyword search tool below to find specific information within the annual report.-
 1
1 -
2
-
3
-
4
-
5
-
6
-
7
-
8
-
9
-
10
-
11
-
12
-
13
-
14
-
15
-
16
-
17
-
18
-
19
-
20
-
21
-
22
-
23
-
24
-
25
-
 26
26 -
 27
27 -
 28
28 -
 29
29 -
 30
30 -
 31
31 -
 32
32 -
 33
33 -
 34
34 -
 35
35 -
 36
36 -
 37
37 -
 38
38 -
 39
39 -
 40
40 -
 41
41 -
 42
42 -
 43
43 -
 44
44 -
 45
45 -
 46
46 -
47
-
48
-
49
-
50
-
51
-
52
-
53
-
54
-
55
-
56
-
57
-
58
-
59
-
60
-
61
-
62
-
63
-
64
-
65
-
66
-
67
-
68
-
69
-
70
-
71
-
72
-
73
-
74
-
75
-
76
-
77
-
78
-
79
-
80
-
81
-
82
-
83
-
84
-
85
-
86
-
87
-
88
-
89
-
90
-
91
-
92
-
93
-
94
-
95
-
96
-
97
-
98
-
99
-
100
-
101
-
102
-
103
-
104
-
105
-
106
-
107
-
108
-
109
-
110
-
111
-
112
-
113
-
114
-
115
-
116
-
117
-
118
-
119
-
120
-
121
-
122
-
123
-
124
-
125
-
126
-
127
-
128
-
129
-
130
-
131
-
132
-
133
-
134
-
135
-
136
-
137
-
138
-
139
-
140
-
141
-
142
-
143
-
144
-
145
-
146
-
147
-
148
-
149
-
150
-
151
-
152
-
153
-
154
-
155
-
156
-
157
-
158
-
159
-
160
-
161
-
162
-
163
-
164
-
165
-
166
-
167
-
168
-
169
-
170
-
171
-
172
-
173
-
174
-
175
-
176
-
177
-
178
-
179
-
180
-
181
-
182
-
183
-
184
-
185
-
186
-
187
-
188
-
189
-
190
-
191
-
192
-
193
-
194
-
195
-
196
-
197
-
198
-
199
-
200
-
201
-
202
-
203
-
204
-
205
-
206
-
207
-
208
-
209
-
210
-
211
-
212
-
213
-
214
-
215
-
216
-
217
-
218
-
219
-
220
-
221
-
222
-
223
-
224
-
225
-
226
-
227
-
228
-
229
-
230
-
231
-
232
-
233
-
234
-
235
-
236
-
237
-
238
-
239
-
240
-
241
-
242
-
243
-
244
-
245
-
246
-
247
-
248
-
249
-
250
-
251
-
252
-
253
-
254
-
255
-
256
-
257
-
258
-
259
-
260
-
261
-
262
-
263
-
264
 |
 |

adidas Group
/
2013 Annual Report
To Our Shareholders
32
2013
/
01.4
/
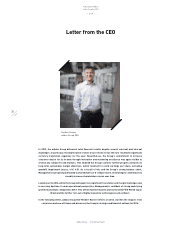
Letter from the CEO
On the other hand, we shouldn’t ignore our many successes in 2013. These definitely outweigh the negatives,
as they derive from key wins in strategic categories and growth markets. This is all the more important,
as winning in these areas fulfils a key deliverable of our Route 2015 strategy – to drive quality growth
and sustainable success for our Group by fuelling consumer desire with premium products and brand
experiences.
Let me share with you a few examples:
/
We called out 2013 as the year of running, and it was exactly that. Sales grew an impressive 17%
currency-neutral, driven by the introduction of our game-changing innovative Boost technology in spring.
/
In the football category, despite tough comparisons, sales were up 4% currency-neutral in a so-called
bridge year between big events. We ended the year with a signal of our intent for 2014 by exciting football
fans around the globe with our colourful and unexpected Samba collection, including a new boot from
each of adidas’ four boot ranges, adizero f50, Predator, Nitrocharge and 11Pro.
/
For our strategically important and youngest sub-brand adidas NEO, we continued to make solid progress
deepening our relationship to the teenage lifestyle consumer. Sales increased 14% currency-neutral
in 2013, with the label now generating almost € 700 million in sales. With a four-year compound annual
growth rate of almost 40%, that is impressive by any standards.
/
At Originals, we are very encouraged by the robust 62% sales increase in action sports. This is a target
consumer group we have been steadily building a strong commitment to, as their flair and sophistication
as curators of product match the essence of what Originals is all about.
/
As promised, we returned to growth with the Reebok brand in 2013, with sales increasing 2% currency-
neutral. Excluding the NFL licence impact that still burdened the first quarter, sales increased 4%
currency-neutral. Add to that the tremendous increase in gross margin of 4.0 percentage points to 39.7%,
we are now in touching distance of our Route 2015 goal to lift the brand margin above 40%.
/
Finally, despite the challenging golf market, TaylorMade-adidas Golf continues to be the undisputed
number one in metalwoods and irons. While it was a tough year overall, we continued to extend our
market share lead in irons across the globe and also gained good market share in footwear, where sales
were up a healthy 16% currency-neutral.
Additionally, from a regional perspective, we again led from the front in key emerging markets such as Latin
America and Greater China, which grew 19% and 7% currency-neutral, respectively. In Latin America, which
will have a lot of attention in 2014, this was of course fuelled by the rising anticipation and excitement ahead
of the World Cup in Brazil. But it also reflects our continuous investments and improvements in this vibrant
part of the world. In China, we continued to hold both our major competitor and the local brands at bay. Sales
increased to over € 1.6 billion. Our management team there continues to execute with excellence, blending
the appeal and attractiveness of adidas, with a deep understanding of the Chinese consumer. All research
confirms that we are one of the hottest brands in China right now, with a fantastic brand footprint, being in
over 7,600 stores in more than 1,000 cities.