MetLife 2007 Annual Report Download - page 92
Download and view the complete annual report
Please find page 92 of the 2007 MetLife annual report below. You can navigate through the pages in the report by either clicking on the pages listed below, or by using the keyword search tool below to find specific information within the annual report.-
 1
1 -
2
-
3
-
4
-
5
-
6
-
7
-
8
-
9
-
10
-
11
-
12
-
13
-
14
-
15
-
16
-
17
-
18
-
19
-
20
-
21
-
22
-
23
-
24
-
25
-
26
-
27
-
28
-
29
-
30
-
31
-
32
-
33
-
34
-
35
-
36
-
37
-
38
-
39
-
40
-
41
-
42
-
43
-
44
-
45
-
46
-
47
-
48
-
49
-
50
-
51
-
52
-
53
-
54
-
55
-
56
-
57
-
58
-
59
-
60
-
61
-
62
-
63
-
64
-
65
-
66
-
67
-
68
-
69
-
70
-
71
-
72
-
73
-
74
-
75
-
76
-
77
-
78
-
79
-
80
-
81
-
 82
82 -
 83
83 -
 84
84 -
 85
85 -
 86
86 -
 87
87 -
 88
88 -
 89
89 -
 90
90 -
 91
91 -
 92
92 -
 93
93 -
 94
94 -
 95
95 -
 96
96 -
 97
97 -
 98
98 -
 99
99 -
 100
100 -
 101
101 -
 102
102 -
103
-
104
-
105
-
106
-
107
-
108
-
109
-
110
-
111
-
112
-
113
-
114
-
115
-
116
-
117
-
118
-
119
-
120
-
121
-
122
-
123
-
124
-
125
-
126
-
127
-
128
-
129
-
130
-
131
-
132
-
133
-
134
-
135
-
136
-
137
-
138
-
139
-
140
-
141
-
142
-
143
-
144
-
145
-
146
-
147
-
148
-
149
-
150
-
151
-
152
-
153
-
154
-
155
-
156
-
157
-
158
-
159
-
160
-
161
-
162
-
163
-
164
-
165
-
166
-
167
-
168
-
169
-
170
-
171
-
172
-
173
-
174
-
175
-
176
-
177
-
178
-
179
-
180
-
181
-
182
-
183
-
184
 |
 |

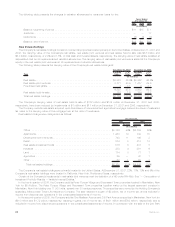
The table below illustrates the potential loss in fair value of the Company’s interest rate sensitive financial instruments at December 31,
2007. In addition, the potential loss with respect to the fair value of currency exchange rates and the Company’s equity price sensitive
positions at December 31, 2007 is set forth in the table below.
The potential loss in fair value for each market risk exposure of the Company’s portfolio at December 31, 2007 was:
December 31, 2007
(In millions)
Non-trading:
Interestraterisk....................................................... $5,170
Equitypricerisk....................................................... $ 96
Foreigncurrencyexchangeraterisk.......................................... $ 711
Trading:
Interestraterisk....................................................... $ 18
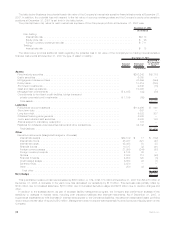
The table below provides additional detail regarding the potential loss in fair value of the Company’s non-trading interest sensitive
financial instruments at December 31, 2007 by type of asset or liability:
Notional
Amount Estimated
Fair Value
Assuming a
10% increase
in the yield
curve
December 31, 2007
(In millions)
Assets
Fixedmaturitysecurities............................................... $242,242 $(5,177)
Equitysecurities .................................................... 6,050 —
Mortgageandconsumerloans........................................... 47,599 (594)
Policyloans....................................................... 10,419 (235)
Short-terminvestments................................................ 2,648 (15)
Cashandcashequivalents ............................................. 10,368 —
Mortgageloancommitments ............................................ $ 4,035 (43) (50)
Commitments to fund bank credit facilities, bridge loans and
privatecorporatebondinvestments ...................................... $ 1,196 (59) —
Totalassets...................................................... $(6,071)
Liabilities
Policyholderaccountbalances........................................... $114,466 $ 840
Short-termdebt .................................................... 667 —
Long-termdebt..................................................... 9,532 307
Collateralfinancingarrangements......................................... 5,365 —
Juniorsubordinateddebtsecurities........................................ 4,338 136
Sharessubjecttomandatoryredemption .................................... 178 —
Payablesforcollateralundersecuritiesloanedandothertransactions.................. 44,136 —
Totalliabilities .................................................... $1,283
Other
Derivative instruments (designated hedges or otherwise)
Interestrateswaps................................................. $62,519 $ 17 $ (132)
Interestratefloors.................................................. 48,937 621 (47)
Interestratecaps.................................................. 45,498 50 33
Financialfutures................................................... 10,817 32 (41)
Foreigncurrencyswaps.............................................. 21,399 (244) (97)
Foreigncurrencyforwards ............................................ 4,185 60 —
Options ........................................................ 2,043 712 (93)
Financialforwards.................................................. 4,600 120 (5)
Creditdefaultswaps................................................ 6,850 23 (1)
SyntheticGICs.................................................... 3,670 — —
Other.......................................................... 250 43 1
Totalother ..................................................... $ (382)
Net change ........................................................ $(5,170)
This quantitative measure of risk has decreased by $805 million, or 13%, to $5,170 million at December 31, 2007 from $5,975 million at
December 31, 2006. A decrease in the yield curve has decreased our sensitivity by $1.5 billion. This decrease was partially offset by
$140 million due to increased asset size, $270 million due to increased derivative usage and $285 million due to duration charges and
other.
In addition to the analysis above, as part of its asset liability management program, the Company also performs an analysis of the
sensitivity to changes in interest rates, including both insurance liabilities and financial instruments. As of December 31, 2007, a
hypothetical instantaneous 10% decrease in interest rates applied to the Company’s liabilities, insurance and associated asset portfolios
would reduce the fair value of equity by $12 million. Management does not expect that this sensitivity would produce a liquidity strain on the
Company.
88 MetLife, Inc.