MetLife 2007 Annual Report Download - page 35
Download and view the complete annual report
Please find page 35 of the 2007 MetLife annual report below. You can navigate through the pages in the report by either clicking on the pages listed below, or by using the keyword search tool below to find specific information within the annual report.-
 1
1 -
2
-
3
-
4
-
5
-
6
-
7
-
8
-
9
-
10
-
11
-
12
-
13
-
14
-
15
-
16
-
17
-
18
-
19
-
20
-
21
-
22
-
23
-
24
-
 25
25 -
 26
26 -
 27
27 -
 28
28 -
 29
29 -
 30
30 -
 31
31 -
 32
32 -
 33
33 -
 34
34 -
 35
35 -
 36
36 -
 37
37 -
 38
38 -
 39
39 -
 40
40 -
 41
41 -
 42
42 -
 43
43 -
 44
44 -
 45
45 -
46
-
47
-
48
-
49
-
50
-
51
-
52
-
53
-
54
-
55
-
56
-
57
-
58
-
59
-
60
-
61
-
62
-
63
-
64
-
65
-
66
-
67
-
68
-
69
-
70
-
71
-
72
-
73
-
74
-
75
-
76
-
77
-
78
-
79
-
80
-
81
-
82
-
83
-
84
-
85
-
86
-
87
-
88
-
89
-
90
-
91
-
92
-
93
-
94
-
95
-
96
-
97
-
98
-
99
-
100
-
101
-
102
-
103
-
104
-
105
-
106
-
107
-
108
-
109
-
110
-
111
-
112
-
113
-
114
-
115
-
116
-
117
-
118
-
119
-
120
-
121
-
122
-
123
-
124
-
125
-
126
-
127
-
128
-
129
-
130
-
131
-
132
-
133
-
134
-
135
-
136
-
137
-
138
-
139
-
140
-
141
-
142
-
143
-
144
-
145
-
146
-
147
-
148
-
149
-
150
-
151
-
152
-
153
-
154
-
155
-
156
-
157
-
158
-
159
-
160
-
161
-
162
-
163
-
164
-
165
-
166
-
167
-
168
-
169
-
170
-
171
-
172
-
173
-
174
-
175
-
176
-
177
-
178
-
179
-
180
-
181
-
182
-
183
-
184
 |
 |
country, and a $25 million and $30 million increase in losses related to higher severity and higher earned exposures, respectively. In
addition, an increase of $20 million in unallocated loss adjustment expenses, primarily resulting from an increase in claims-related
information technology costs, and a $19 million decrease in favorable development of prior year losses, representing $148 million of
favorable development for 2007 as compared to $167 million for the 2006 period, increased policyholder benefits and claims. Offsetting
these increases in losses was a decrease of $63 million in catastrophe losses, which includes $15 million of favorable loss development
from prior year catastrophes.
Policyholder dividends decreased by $2 million in 2007 as compared to the prior year.
Other expenses decreased by $15 million primarily related to lower information technology and advertising costs, partially offset by
minor changes in a variety of expense categories.
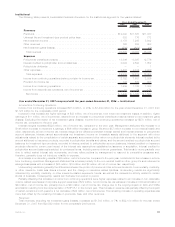
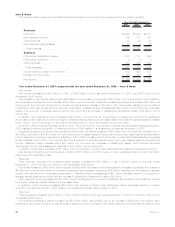
Underwriting results, excluding catastrophes, in the Auto & Home segment were favorable for the year ended December 31, 2007,
although lower than the comparable period of 2006, as the combined ratio, excluding catastrophes, increased to 86.3% from 82.8% for the
year ended December 31, 2006.
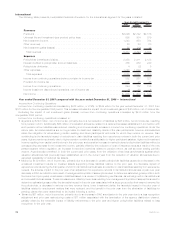
Year ended December 31, 2006 compared with the year ended December 31, 2005 — Auto & Home
Net Income
Net income increased by $192 million, or 86%, to $416 million for the year ended December 31, 2006 from $224 million for the
comparable 2005 period.
The increase in net income was primarily attributable to a loss in the third quarter of 2005 from Hurricane Katrina of $124 million, net of
income tax, related to losses, loss adjusting expenses and reinstatement and additional reinsurance-related premiums and a loss in the
fourth quarter of 2005 related to losses and expenses from Hurricane Wilma of $32 million, net of income tax. Excluding the losses from
Hurricanes Katrina and Wilma, net income increased by $36 million for the year ended December 31, 2006 from the comparable 2005
period.
Favorable development of prior year loss reserves contributed $72 million, net of income tax, to the increase in net income. In addition,
an improvement in non-catastrophe loss experience, primarily due to improved frequencies, contributed $16 million, net of income tax and
a reduction in loss adjustment expenses, primarily due to improved claims handling practices, contributed $13 million, net of income tax, to
the increase. The increase in net income was offset by higher catastrophe losses in the current year, excluding the impact of Katrina and
Wilma, resulting in a decrease to net income of $49 million, net of income tax.
Also impacting net income was a decrease in net earned premiums, excluding the impact of Hurricane Katrina, of $19 million, net of
income tax, resulting primarily from an increase of $16 million, net of income tax, in catastrophe reinsurance costs and a reduction of
$4 million, net of income tax, in involuntary assumed business, offset by an increase in premiums of $1 million, net of income tax, primarily
from increased exposures, mostly offset by lower average premium per policy.
In addition, other revenues decreased by $7 million, net of income tax, due to slower than anticipated claims payments resulting in
slower recognition of deferred income related to a reinsurance contract. Net investment income decreased by $3 million, net of income tax,
due to a $12 million decrease in net investment income related to a realignment of economic capital, partially offset by a $9 million increase
in income as a result of a slightly higher asset base. Net investment gains (losses) increased $10 million, net of income tax, for the year
ended December 31, 2006 compared to the comparable 2005 period. Other expenses increased by $11 million, net of income tax,
primarily due to expenditures related to information technology, advertising and compensation costs.
The change in effective tax rates between periods accounted for the remainder of the increase in net income.
Revenues
Total revenues, excluding net investment gains (losses), decreased by $2 million, or less than 1%, to $3,123 million for the year ended
December 31, 2006 from $3,125 million for the comparable 2005 period.
Premiums increased by $13 million due principally to the existence of a $43 million charge for reinstatement and additional reinsurance
premiums in the third quarter of 2005 related to Hurricane Katrina. Premiums decreased by $30 million year over year after giving
consideration to this charge. This decrease resulted from $25 million in additional catastrophe reinsurance costs and a decrease of
$6 million in involuntary assumed business in 2006, mainly associated with the Massachusetts involuntary market. These changes were
partially offset by an increase in premiums of $35 million resulting from increased exposures, offset by a $34 million decrease in premiums
from a change in the average earned premium per policy.
Net investment income decreased by $4 million primarily due to an $18 million decrease in net investment income related to a
realignment of economic capital, mostly offset by a $14 million increase in income as a result of a slightly higher asset base with slightly
higher yields.
Other revenues decreased by $11 million due to slower than anticipated claims payments resulting in a slower recognition of deferred
income related to a reinsurance contract.
Expenses
Total expenses decreased by $257 million, or 9%, to $2,568 million for the year ended December 31, 2006 from $2,825 million for the
comparable 2005 period.
Policyholder benefits and claims decreased by $277 million which was primarily due to $196 million in claims and expenses related to
Hurricanes Katrina and Wilma incurred in 2005. The remainder of the decrease in policyholder benefits and claims for the year ended
December 31, 2006, as compared to the same period in 2005, can be attributed to $111 million in additional favorable development of
prior year losses, improvements in claim frequencies of $72 million and a decrease of $20 million in unallocated loss expense due primarily
to improved claims handling practices. These decreases in policyholder benefits and claims for the year ended December 31, 2006,
compared to the same period in 2005, were partially offset by $32 million of additional losses due to severity, $15 million of additional
losses due to exposure growth and a $75 million increase in catastrophe losses, excluding Hurricanes Katrina and Wilma.
Other expenses increased by $17 million primarily due to expenditures related to information technology, advertising and compensation
costs.
Underwriting results, excluding catastrophes, in the Auto & Home segment were favorable for the year ended December 31, 2006, as
the combined ratio, excluding catastrophes, decreased to 82.8% from 86.7% for the year ended December 31, 2005.
31MetLife, Inc.