MetLife 2007 Annual Report Download - page 172
Download and view the complete annual report
Please find page 172 of the 2007 MetLife annual report below. You can navigate through the pages in the report by either clicking on the pages listed below, or by using the keyword search tool below to find specific information within the annual report.-
 1
1 -
2
-
3
-
4
-
5
-
6
-
7
-
8
-
9
-
10
-
11
-
12
-
13
-
14
-
15
-
16
-
17
-
18
-
19
-
20
-
21
-
22
-
23
-
24
-
25
-
26
-
27
-
28
-
29
-
30
-
31
-
32
-
33
-
34
-
35
-
36
-
37
-
38
-
39
-
40
-
41
-
42
-
43
-
44
-
45
-
46
-
47
-
48
-
49
-
50
-
51
-
52
-
53
-
54
-
55
-
56
-
57
-
58
-
59
-
60
-
61
-
62
-
63
-
64
-
65
-
66
-
67
-
68
-
69
-
70
-
71
-
72
-
73
-
74
-
75
-
76
-
77
-
78
-
79
-
80
-
81
-
82
-
83
-
84
-
85
-
86
-
87
-
88
-
89
-
90
-
91
-
92
-
93
-
94
-
95
-
96
-
97
-
98
-
99
-
100
-
101
-
102
-
103
-
104
-
105
-
106
-
107
-
108
-
109
-
110
-
111
-
112
-
113
-
114
-
115
-
116
-
117
-
118
-
119
-
120
-
121
-
122
-
123
-
124
-
125
-
126
-
127
-
128
-
129
-
130
-
131
-
132
-
133
-
134
-
135
-
136
-
137
-
138
-
139
-
140
-
141
-
142
-
143
-
144
-
145
-
146
-
147
-
148
-
149
-
150
-
151
-
152
-
153
-
154
-
155
-
156
-
157
-
158
-
159
-
160
-
161
-
 162
162 -
 163
163 -
 164
164 -
 165
165 -
 166
166 -
 167
167 -
 168
168 -
 169
169 -
 170
170 -
 171
171 -
 172
172 -
 173
173 -
 174
174 -
 175
175 -
 176
176 -
 177
177 -
 178
178 -
 179
179 -
 180
180 -
 181
181 -
 182
182 -
183
-
184
 |
 |

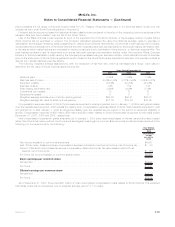
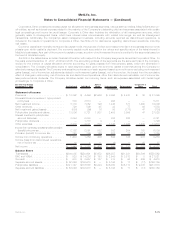
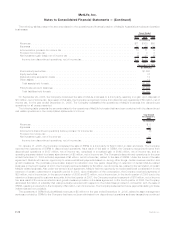
For the Year Ended
December 31, 2006 Institutional Individual Auto &
Home International Reinsurance Corporate &
Other Total
(In millions)
Statement of Income:
Premiums ....................... $ 11,867 $ 4,516 $2,924 $ 2,722 $ 4,348 $ 35 $ 26,412
Universal life and investment- type product
policyfees ..................... 775 3,201 — 804 — — 4,780
Net investment income . . . . . . . . . . . . . . . 7,265 6,912 177 950 732 1,046 17,082
Otherrevenues.................... 685 527 22 28 66 34 1,362
Net investment gains (losses) . . . . . . . . . . . (631) (598) 4 (10) 7 (154) (1,382)
Policyholder benefits and claims . . . . . . . . . 13,367 5,409 1,717 2,411 3,490 37 26,431
Interest credited to policyholder
account balances . . . . . . . . . . . . . . . . . 2,593 2,035 — 289 254 — 5,171
Policyholderdividends ............... — 1,697 6 (2) — — 1,701
Other expenses. . . . . . . . . . . . . . . . . . . . 2,314 3,519 845 1,529 1,227 1,349 10,783
Income (loss) from continuing operations before
provision (benefit) for income tax . . . . . . . . . . 1,687 1,898 559 267 182 (425) 4,168
Provision (benefit) for income tax. . . . . . . . . 562 652 143 95 64 (419) 1,097
Income (loss) from continuing operations . . . 1,125 1,246 416 172 118 (6) 3,071
Income from discontinued operations, net of
incometax ..................... 42 18 — 28 — 3,134 3,222
Netincome ...................... $ 1,167 $ 1,264 $ 416 $ 200 $ 118 $ 3,128 $ 6,293
Balance Sheet:
Total assets . . . . . . . . . . . . . . . . . . . . . . $190,963 $243,604 $5,467 $22,724 $18,818 $46,139 $527,715
DAC and VOBA . . . . . . . . . . . . . . . . . . . . $ 1,370 $ 13,996 $ 190 $ 2,117 $ 3,152 $ 13 $ 20,838
Goodwill ........................ $ 977 $ 2,957 $ 157 $ 301 $ 96 $ 409 $ 4,897
Separate account assets. . . . . . . . . . . . . . $ 47,047 $ 94,124 $ — $ 3,178 $ 16 $ — $144,365
Policyholder liabilities . . . . . . . . . . . . . . . . $113,205 $117,866 $3,453 $13,544 $13,332 $ 9,199 $270,599
Separate account liabilities . . . . . . . . . . . . $ 47,047 $ 94,124 $ — $ 3,178 $ 16 $ — $144,365
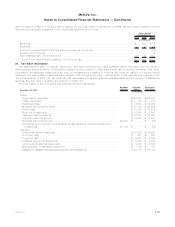
For the Year Ended
December 31, 2005 Institutional Individual Auto &
Home International Reinsurance Corporate &
Other Total
(In millions)
Statement of Income:
Premiums ......................... $11,387 $4,485 $2,911 $2,186 $3,869 $ 22 $24,860
Universal life and investment- type product
policyfees....................... 772 2,476 — 579 — 1 3,828
Net investment income. . . . . . . . . . . . . . . . . 5,942 6,534 181 794 606 699 14,756
Otherrevenues...................... 653 477 33 20 58 30 1,271
Netinvestmentgains(losses) ............ (10) (50) (12) 12 22 (48) (86)
Policyholder benefits and claims . . . . . . . . . . 12,776 5,417 1,994 2,128 3,206 (15) 25,506
Interest credited to policyholder
accountbalances................... 1,652 1,775 — 240 220 — 3,887
Policyholderdividends................. 1 1,670 3 5 — — 1,679
Other expenses . . . . . . . . . . . . . . . . . . . . . 2,229 3,264 828 997 991 955 9,264
Income (loss) from continuing operations before
provision (benefit) for income tax . . . . . . . . . . . . 2,086 1,796 288 221 138 (236) 4,293
Provision (benefit) for income tax . . . . . . . . . . 698 594 64 35 46 (215) 1,222
Income (loss) from continuing operations . . . . . 1,388 1,202 224 186 92 (21) 3,071
Income from discontinued operations, net of
incometax....................... 174 296 — 6 — 1,167 1,643
Netincome........................ $ 1,562 $1,498 $ 224 $ 192 $ 92 $1,146 $ 4,714
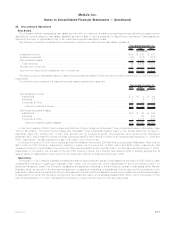
Net investment income and net investment gains (losses) are based upon the actual results of each segment’s specifically identifiable
asset portfolio adjusted for allocated equity. Other costs are allocated to each of the segments based upon: (i) a review of the nature of
such costs; (ii) time studies analyzing the amount of employee compensation costs incurred by each segment; and (iii) cost estimates
included in the Company’s product pricing.
Revenues derived from any customer did not exceed 10% of consolidated revenues for the years ended December 31, 2007, 2006 and
2005. Revenues from U.S. operations were $45.4 billion, $41.9 billion and $39.5 billion for the years ended December 31, 2007, 2006 and
2005, respectively, which represented 86%, 87% and 89%, respectively, of consolidated revenues.
F-76 MetLife, Inc.
MetLife, Inc.
Notes to Consolidated Financial Statements — (Continued)