MetLife 2007 Annual Report Download - page 32
Download and view the complete annual report
Please find page 32 of the 2007 MetLife annual report below. You can navigate through the pages in the report by either clicking on the pages listed below, or by using the keyword search tool below to find specific information within the annual report.-
 1
1 -
2
-
3
-
4
-
5
-
6
-
7
-
8
-
9
-
10
-
11
-
12
-
13
-
14
-
15
-
16
-
17
-
18
-
19
-
20
-
21
-
 22
22 -
 23
23 -
 24
24 -
 25
25 -
 26
26 -
 27
27 -
 28
28 -
 29
29 -
 30
30 -
 31
31 -
 32
32 -
 33
33 -
 34
34 -
 35
35 -
 36
36 -
 37
37 -
 38
38 -
 39
39 -
 40
40 -
 41
41 -
 42
42 -
43
-
44
-
45
-
46
-
47
-
48
-
49
-
50
-
51
-
52
-
53
-
54
-
55
-
56
-
57
-
58
-
59
-
60
-
61
-
62
-
63
-
64
-
65
-
66
-
67
-
68
-
69
-
70
-
71
-
72
-
73
-
74
-
75
-
76
-
77
-
78
-
79
-
80
-
81
-
82
-
83
-
84
-
85
-
86
-
87
-
88
-
89
-
90
-
91
-
92
-
93
-
94
-
95
-
96
-
97
-
98
-
99
-
100
-
101
-
102
-
103
-
104
-
105
-
106
-
107
-
108
-
109
-
110
-
111
-
112
-
113
-
114
-
115
-
116
-
117
-
118
-
119
-
120
-
121
-
122
-
123
-
124
-
125
-
126
-
127
-
128
-
129
-
130
-
131
-
132
-
133
-
134
-
135
-
136
-
137
-
138
-
139
-
140
-
141
-
142
-
143
-
144
-
145
-
146
-
147
-
148
-
149
-
150
-
151
-
152
-
153
-
154
-
155
-
156
-
157
-
158
-
159
-
160
-
161
-
162
-
163
-
164
-
165
-
166
-
167
-
168
-
169
-
170
-
171
-
172
-
173
-
174
-
175
-
176
-
177
-
178
-
179
-
180
-
181
-
182
-
183
-
184
 |
 |
time to reflect market interest rate movements, subject to any minimum guarantees and, therefore, generally does not introduce
volatility in expense.
The change in effective tax rates between periods accounts for the remainder of the decrease in income from continuing operations.
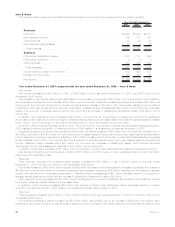
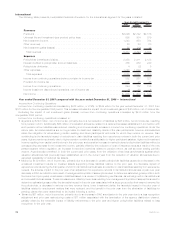
Revenues
Total revenues, excluding net investment gains (losses), increased by $504 million, or 3%, to $15,660 million for the year ended
December 31, 2007 from $15,156 million for the comparable 2006 period.
Premiums decreased by $20 million due to a decrease in immediate annuity premiums of $27 million, and an $89 million decline in
premiums associated with the Company’s closed block of business, in line with expectations. These decreases were partially offset by
growth in premiums from other life products of $96 million, primarily driven by increased sales of term life business.
Universal life and investment-type product policy fees combined with other revenues increased by $384 million due to a combination of
growth in the business and improved overall market performance, as well as revisions to management’s assumptions used to determine
estimated gross profits and margins. Policy fees from variable life and annuity and investment-type products are typically calculated as a
percentage of the average assets in policyholder accounts. The value of these assets can fluctuate depending on equity performance.
Net investment income increased by $140 million. Net investment income from the general account portion of investment-type products
and other businesses increased by $45 million and $95 million, respectively. Management attributes $5 million of this increase to an
increase in yields, primarily due to higher returns on other limited partnership interests. Additionally, management attributes $135 million to
growth in the average asset base across various investment types.
Expenses
Total expenses increased by $840 million, or 7%, to $13,500 million for the year ended December 31, 2007 from $12,660 million for the
comparable 2006 period.
Policyholder benefits and claims increased by $312 million primarily due to an increase in the closed block-related policyholder dividend
obligation of $115 million which was primarily driven by net investment gains. Unfavorable mortality in the life products, as well as revisions
to policyholder benefits in both periods, contributed $180 million to this increase. Included in this increase was $72 million of unfavorable
mortality in the closed block and a prior year net increase of $15 million in the excess mortality liability on specific blocks of life insurance
policies. Higher amortization of sales inducements resulting from business growth and revisions to management’s assumptions used to
determine estimated gross profits and margins, partially offset by lower costs of guaranteed annuity benefit riders and related hedging
increased annuity benefits by $37 million. Partially offsetting these increases, policyholder benefits and claims decreased by $20 million
commensurate with the decrease in premiums discussed above.
Interest credited to policyholder account balances decreased by $5 million. Interest credited on the general account portion of
investment-type products and other businesses decreased by $15 million and $10 million, respectively. Of the $15 million decrease on the
general account portion of investment-type products, management attributed $67 million to higher crediting rates, more than offset by
$82 million due to lower average policyholder account balances. Partially offsetting these decreases was lower amortization of the excess
interest reserves on acquired annuity and universal life blocks of business of $20 million primarily driven by lower lapses in the current year.
Policyholder dividends increased by $21 million due to growth in the business.
Higher other expenses of $512 million include higher DAC amortization of $314 million resulting from business growth, lower net
investment losses and revisions to management’s assumptions used to determine estimated gross profits and margins. The remaining
increase in other expenses of $198 million was comprised of $167 million associated with business growth, information technology and
other general expenses, $7 million due to the impact of revisions to certain liabilities including pension and postretirement liabilities and
policyholder liabilities in the prior year, and $24 million associated with the write-off of a receivable from one of the Company’s joint venture
partners in the current year.
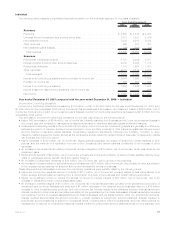
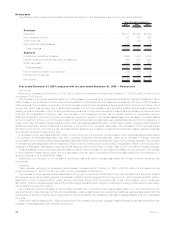
Year ended December 31, 2006 compared with the year ended December 31, 2005 — Individual
Income from Continuing Operations
Income from continuing operations increased by $44 million, or 4%, to $1,246 million for the year ended December 31, 2006 from
$1,202 million for the comparable 2005 period. The acquisition of Travelers contributed $112 million during the first six months of 2006 to
income from continuing operations, which included $88 million, net of income tax, of net investment losses. Included in the Travelers
results was a $21 million increase to the excess mortality liability on specific blocks of life insurance policies. Excluding the impact of
Travelers, income from continuing operations decreased by $68 million, or 6%, to $1,134 million for the year ended December 31, 2006
from $1,202 million for the comparable 2005 period.
Included in this decrease were net investment losses of $270 million, net of income tax. Excluding the impact of net investment gains
(losses) and the acquisition of Travelers for the first six months of 2006, income from continuing operations increased by $202 million from
the comparable 2005 period.
The increase in income from continuing operations for the year was driven by the following items:
• Higher fee income from separate account products of $151 million, net of income tax, primarily related to fees being earned on a
higher average account balance resulting from a combination of growth in the business and overall market performance.
• Lower DAC amortization of $113 million, net of income tax, resulting from investment losses and revisions to management’s
assumptions used to determine estimated gross profits and margins.
• A decrease in the closed block-related policyholder dividend obligation of $68 million, net of income tax.
• Favorable underwriting results in life products of $61 million, net of income tax. Underwriting results are generally the difference
between the portion of premium and fee income intended to cover mortality, morbidity or other insurance costs less claims incurred
and the change in insurance-related liabilities. Underwriting results are significantly influenced by mortality, morbidity, or other
insurance-related experience trends, as well as the reinsurance activity related to certain blocks of business. Consequently, results
can fluctuate from period to period.
• Higher net investment income on blocks of business that were not driven by interest margins of $16 million, net of income tax.
28 MetLife, Inc.