MetLife 2007 Annual Report Download - page 24
Download and view the complete annual report
Please find page 24 of the 2007 MetLife annual report below. You can navigate through the pages in the report by either clicking on the pages listed below, or by using the keyword search tool below to find specific information within the annual report.-
 1
1 -
2
-
3
-
4
-
5
-
6
-
7
-
8
-
9
-
10
-
11
-
12
-
13
-
 14
14 -
 15
15 -
 16
16 -
 17
17 -
 18
18 -
 19
19 -
 20
20 -
 21
21 -
 22
22 -
 23
23 -
 24
24 -
 25
25 -
 26
26 -
 27
27 -
 28
28 -
 29
29 -
 30
30 -
 31
31 -
 32
32 -
 33
33 -
 34
34 -
35
-
36
-
37
-
38
-
39
-
40
-
41
-
42
-
43
-
44
-
45
-
46
-
47
-
48
-
49
-
50
-
51
-
52
-
53
-
54
-
55
-
56
-
57
-
58
-
59
-
60
-
61
-
62
-
63
-
64
-
65
-
66
-
67
-
68
-
69
-
70
-
71
-
72
-
73
-
74
-
75
-
76
-
77
-
78
-
79
-
80
-
81
-
82
-
83
-
84
-
85
-
86
-
87
-
88
-
89
-
90
-
91
-
92
-
93
-
94
-
95
-
96
-
97
-
98
-
99
-
100
-
101
-
102
-
103
-
104
-
105
-
106
-
107
-
108
-
109
-
110
-
111
-
112
-
113
-
114
-
115
-
116
-
117
-
118
-
119
-
120
-
121
-
122
-
123
-
124
-
125
-
126
-
127
-
128
-
129
-
130
-
131
-
132
-
133
-
134
-
135
-
136
-
137
-
138
-
139
-
140
-
141
-
142
-
143
-
144
-
145
-
146
-
147
-
148
-
149
-
150
-
151
-
152
-
153
-
154
-
155
-
156
-
157
-
158
-
159
-
160
-
161
-
162
-
163
-
164
-
165
-
166
-
167
-
168
-
169
-
170
-
171
-
172
-
173
-
174
-
175
-
176
-
177
-
178
-
179
-
180
-
181
-
182
-
183
-
184
 |
 |

pension business in the prior period and an increase in other expenses, primarily related to expenses associated with DAC, interest
expense, minority interest expense and equity compensation costs.
Revenues and Expenses
Premiums, Fees and Other Revenues
Premiums, fees and other revenues increased by $2,595 million, or 9%, to $32,554 million for the year ended December 31, 2006 from
$29,959 million for the comparable 2005 period. Excluding the impact of the acquisition of Travelers, which contributed $945 million during
the first six months of 2006 to the year over year increase, premiums, fees and other revenues increased by $1,650 million.
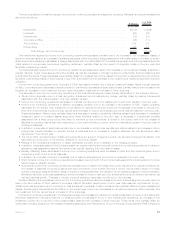
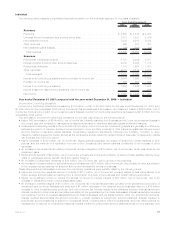
The following table provides the change in premiums, fees and other revenues by segment, excluding Travelers:
$ Change %ofTotal
$ Change
(In millions)
Reinsurance....................................................... $ 487 30%
International ....................................................... 470 28
Institutional........................................................ 458 28
Individual ......................................................... 229 14
Corporate&Other ................................................... 4 —
Auto&Home....................................................... 2 —
Totalchange................................................... $1,650 100%
The growth in the Reinsurance segment was primarily attributable to premiums from new facultative and automatic treaties and renewal
premiums on existing blocks of business in the U.S. and international operations.
ThegrowthintheInternationalsegmentwasprimarilyduetothefollowingfactors:
• An increase in Mexico’s premiums, fees and other revenues due to growth in the business and higher fees, partially offset by an
adjustment for experience refunds on a block of business and various one- time other revenue items in both years.
• South Korea’s premiums, fees and other revenues increased due to business growth, as well as the favorable impact of foreign
currency exchange rates.
• Brazil’s premiums, fees and other revenues increased due to business growth and higher bancassurance business, as well as an
increase in amounts retained under reinsurance arrangements.
• Chile’s premiums, fees and other revenues increased primarily due to higher institutional premiums through its bank distribution
channel, partially offset by lower annuity sales.
• Business growth in the United Kingdom, Argentina, Australia and Taiwan, as well as the favorable impact of changes in foreign
currency exchange rates, also contributed to the increase in the International segment.
The growth in the Institutional segment was primarily due to growth in the dental, disability, AD&D products, as well as growth in the LTC
and IDI businesses, all within the non-medical health & other business. Additionally, growth in the group life business was attributable to the
impact of sales and favorable persistency largely in the term life business. These increases in the non-medical health & other and group life
businesses were partially offset by a decrease in the retirement & savings business. The decline in retirement & savings was primarily due
to a decline in premiums from structured settlements predominantly due to lower sales, partially offset by an increase in master terminal
funding premiums (“MTF”).
The growth in the Individual segment was primarily due to higher fee income from universal life and investment-type products and an
increase in premiums from other life products, partially offset by a decrease in immediate annuity premiums and a decline in premiums
associated with the Company’s closed block business as this business continues to run-off.
Net Investment Income
Net investment income increased by $2,326 million, or 16%, to $17,082 million for the year ended December 31, 2006 from
$14,756 million for the comparable 2005 period. Excluding the impact of the acquisition of Travelers, which contributed $1,425 million
during the first six months of 2006 to the year over year increase, net investment income increased by $901 million of which management
attributes $648 million to growth in the average asset base and $253 million to an increase in yields. This increase was primarily due to an
overall increase in the asset base, an increase in fixed maturity security yields, improved results on real estate and real estate joint
ventures, mortgage loans, and other limited partnership interests, as well as higher short-term interest rates on cash equivalents and short-
term investments. These increases were partially offset by a decline in investment income from securities lending results, and bond and
commercial mortgage prepayment fees.
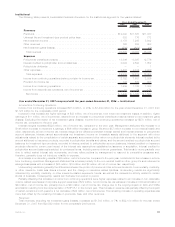
Interest Margin
Interest margin, which represents the difference between interest earned and interest credited to policyholder account balances,
decreased in the Institutional and Individual segments for the year ended December 31, 2006 as compared to the prior year. Interest
earned approximates net investment income on investable assets attributed to the segment with minor adjustments related to the
consolidation of certain separate accounts and other minor non-policyholder elements. Interest credited is the amount attributed to
insurance products, recorded in policyholder benefits and claims, and the amount credited to policyholder account balances for
investment-type products, recorded in interest credited to policyholder account balances. Interest credited on insurance products
reflects the current period impact of the interest rate assumptions established at issuance or acquisition. Interest credited to policyholder
account balances is subject to contractual terms, including some minimum guarantees. This tends to move gradually over time to reflect
market interest rate movements and may reflect actions by management to respond to competitive pressures and, therefore, generally
does not introduce volatility in expense.
20 MetLife, Inc.