MetLife 2007 Annual Report Download - page 129
Download and view the complete annual report
Please find page 129 of the 2007 MetLife annual report below. You can navigate through the pages in the report by either clicking on the pages listed below, or by using the keyword search tool below to find specific information within the annual report.-
 1
1 -
2
-
3
-
4
-
5
-
6
-
7
-
8
-
9
-
10
-
11
-
12
-
13
-
14
-
15
-
16
-
17
-
18
-
19
-
20
-
21
-
22
-
23
-
24
-
25
-
26
-
27
-
28
-
29
-
30
-
31
-
32
-
33
-
34
-
35
-
36
-
37
-
38
-
39
-
40
-
41
-
42
-
43
-
44
-
45
-
46
-
47
-
48
-
49
-
50
-
51
-
52
-
53
-
54
-
55
-
56
-
57
-
58
-
59
-
60
-
61
-
62
-
63
-
64
-
65
-
66
-
67
-
68
-
69
-
70
-
71
-
72
-
73
-
74
-
75
-
76
-
77
-
78
-
79
-
80
-
81
-
82
-
83
-
84
-
85
-
86
-
87
-
88
-
89
-
90
-
91
-
92
-
93
-
94
-
95
-
96
-
97
-
98
-
99
-
100
-
101
-
102
-
103
-
104
-
105
-
106
-
107
-
108
-
109
-
110
-
111
-
112
-
113
-
114
-
115
-
116
-
117
-
118
-
 119
119 -
 120
120 -
 121
121 -
 122
122 -
 123
123 -
 124
124 -
 125
125 -
 126
126 -
 127
127 -
 128
128 -
 129
129 -
 130
130 -
 131
131 -
 132
132 -
 133
133 -
 134
134 -
 135
135 -
 136
136 -
 137
137 -
 138
138 -
 139
139 -
140
-
141
-
142
-
143
-
144
-
145
-
146
-
147
-
148
-
149
-
150
-
151
-
152
-
153
-
154
-
155
-
156
-
157
-
158
-
159
-
160
-
161
-
162
-
163
-
164
-
165
-
166
-
167
-
168
-
169
-
170
-
171
-
172
-
173
-
174
-
175
-
176
-
177
-
178
-
179
-
180
-
181
-
182
-
183
-
184
 |
 |

During the second quarter of 2006, MetLife’s ownership interests in Tribeca declined to a position whereby Tribeca is no longer
consolidated and, as of June 30, 2006, was accounted for under the equity method of accounting. The equity method investment at
December 31, 2006 of $82 million was included in other limited partnership interests. Net investment income related to the Company’s
equity method investment in Tribeca was $9 million for the six months ended December 31, 2006.
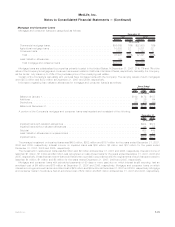
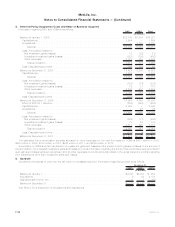
Variable Interest Entities
The following table presents the total assets of and maximum exposure to loss relating to VIEs for which the Company has concluded
that: (i) it is the primary beneficiary and which are consolidated in the Company’s consolidated financial statements at December 31, 2007;
and (ii) it holds significant variable interests but it is not the primary beneficiary and which have not been consolidated:
Total
Assets(1)
Maximum
Exposure to
Loss(2) Total
Assets(1)
Maximum
Exposure to
Loss(2)
Primary Beneficiary Not Primary Beneficiary
December 31, 2007
(In millions)
Asset-backed securitizations and collateralized debt obligations . . . . . . . . . . $1,167 $1,167 $ 1,591 $ 184
Realestatejointventures(3) ................................. 48 26 276 42
Otherlimitedpartnershipinterests(4)............................ 2 1 42,141 2,080
Trustpreferredsecurities(5).................................. 105 105 48,232 3,369
Otherinvestments(6)...................................... 1,119 1,119 3,258 260
Total ............................................... $2,441 $2,418 $95,498 $5,935
(1) The assets of the asset-backed securitizations and collateralized debt obligations are reflected at fair value. The assets of the real estate
joint ventures, other limited partnership interests, trust preferred securities and other investments are reflected at the carrying amounts at
which such assets would have been reflected on the Company’s consolidated balance sheet had the Company consolidated the VIE from
the date of its initial investment in the entity.
(2) The maximum exposure to loss relating to the asset-backed securitizations and collateralized debt obligations is equal to the carrying
amounts of retained interests. In addition, the Company provides collateral management services for certain of these structures for which
it collects a management fee. The maximum exposure to loss relating to real estate joint ventures, other limited partnership interests, trust
preferred securities and other investments is equal to the carrying amounts plus any unfunded commitments, reduced by amounts
guaranteed by other partners. Such a maximum loss would be expected to occur only upon bankruptcy of the issuer or investee.
(3) Real estate joint ventures include partnerships and other ventures which engage in the acquisition, development, management and
disposal of real estate investments.
(4) Other limited partnership interests include partnerships established for the purpose of investing in public and private debt and equity
securities.
(5) Trust preferred securities are complex, uniquely structured investments which contain features of both equity and debt, may have an
extended or no stated maturity, and may be callable at the issuer’s option after a defined period of time.
(6) Other investments include securities that are not trust preferred securities, asset-backed securitizations or collateralized debt obligations
and the assets supporting the financing arrangement described in Note 11.
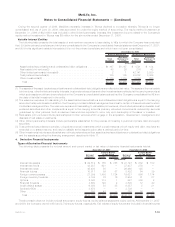
4. Derivative Financial Instruments
Types of Derivative Financial Instruments
The following table presents the notional amount and current market or fair value of derivative financial instruments held at:
Notional
Amount Assets Liabilities Notional
Amount Assets Liabilities
Current Market
or Fair Value Current Market
or Fair Value
December 31, 2007 December 31, 2006
(In millions)
Interestrateswaps .......................... $ 62,519 $ 785 $ 768 $ 27,148 $ 639 $ 150
Interestratefloors........................... 48,937 621 — 37,437 279 —
Interestratecaps ........................... 45,498 50 — 26,468 125 —
Financialfutures............................ 10,817 89 57 8,432 64 39
Foreign currency swaps . . . . . . . . . . . . . . . . . . . . . . . 21,399 1,480 1,724 19,627 986 1,174
Foreigncurrencyforwards...................... 4,185 76 16 2,934 31 27
Options.................................. 2,043 713 1 587 306 8
Financialforwards........................... 4,600 122 2 3,800 12 40
Creditdefaultswaps ......................... 6,850 58 35 6,357 5 21
SyntheticGICs............................. 3,670 — — 3,739 — —
Other ................................... 250 43 — 250 56 —
Total .................................. $210,768 $4,037 $2,603 $136,779 $2,503 $1,459
The above table does not include notional amounts for equity futures, equity variance swaps and equity options. At December 31, 2007
and 2006, the Company owned 4,658 and 2,749 equity futures, respectively. Fair values of equity futures are included in financial futures
F-33MetLife, Inc.
MetLife, Inc.
Notes to Consolidated Financial Statements — (Continued)