MetLife 2007 Annual Report Download - page 160
Download and view the complete annual report
Please find page 160 of the 2007 MetLife annual report below. You can navigate through the pages in the report by either clicking on the pages listed below, or by using the keyword search tool below to find specific information within the annual report.-
 1
1 -
2
-
3
-
4
-
5
-
6
-
7
-
8
-
9
-
10
-
11
-
12
-
13
-
14
-
15
-
16
-
17
-
18
-
19
-
20
-
21
-
22
-
23
-
24
-
25
-
26
-
27
-
28
-
29
-
30
-
31
-
32
-
33
-
34
-
35
-
36
-
37
-
38
-
39
-
40
-
41
-
42
-
43
-
44
-
45
-
46
-
47
-
48
-
49
-
50
-
51
-
52
-
53
-
54
-
55
-
56
-
57
-
58
-
59
-
60
-
61
-
62
-
63
-
64
-
65
-
66
-
67
-
68
-
69
-
70
-
71
-
72
-
73
-
74
-
75
-
76
-
77
-
78
-
79
-
80
-
81
-
82
-
83
-
84
-
85
-
86
-
87
-
88
-
89
-
90
-
91
-
92
-
93
-
94
-
95
-
96
-
97
-
98
-
99
-
100
-
101
-
102
-
103
-
104
-
105
-
106
-
107
-
108
-
109
-
110
-
111
-
112
-
113
-
114
-
115
-
116
-
117
-
118
-
119
-
120
-
121
-
122
-
123
-
124
-
125
-
126
-
127
-
128
-
129
-
130
-
131
-
132
-
133
-
134
-
135
-
136
-
137
-
138
-
139
-
140
-
141
-
142
-
143
-
144
-
145
-
146
-
147
-
148
-
149
-
 150
150 -
 151
151 -
 152
152 -
 153
153 -
 154
154 -
 155
155 -
 156
156 -
 157
157 -
 158
158 -
 159
159 -
 160
160 -
 161
161 -
 162
162 -
 163
163 -
 164
164 -
 165
165 -
 166
166 -
 167
167 -
 168
168 -
 169
169 -
 170
170 -
171
-
172
-
173
-
174
-
175
-
176
-
177
-
178
-
179
-
180
-
181
-
182
-
183
-
184
 |
 |

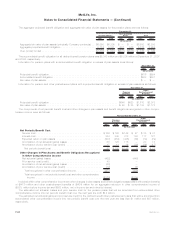
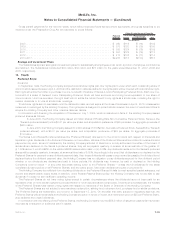
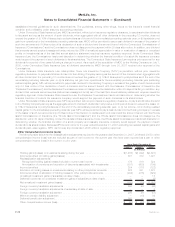
Assumed healthcare cost trend rates may have a significant effect on the amounts reported for healthcare plans. A one-percentage
point change in assumed healthcare cost trend rates would have the following effects:
One Percent
Increase One Percent
Decrease
(In millions)
Effectontotalofserviceandinterestcostcomponents .............................. $ 7 $ (6)
Effectofaccumulatedpostretirementbenefitobligation .............................. $63 $(62)
Plan Assets
The Subsidiaries have issued group annuity and life insurance contracts supporting approximately 98% of all pension and other
postretirement benefit plans assets.
The account values of the group annuity and life insurance contracts issued by the Subsidiaries and held as assets of the pension and
other postretirement benefit plans were $7,565 million and $7,321 million as of December 31, 2007 and 2006, respectively. The majority of
such account values are held in separate accounts established by the Subsidiaries. Total revenue from these contracts recognized in the
consolidated statements of income was $28 million, $29 million and $28 million for the years ended December 31, 2007, 2006 and 2005,
respectively, and includes policy charges, net investment income from investments backing the contracts and administrative fees. Total
investment income, including realized and unrealized gains and losses, credited to the account balances were $603 million, $818 million
and $460 million for the years ended December 31, 2007, 2006 and 2005, respectively. The terms of these contracts are consistent in all
material respects with those the Subsidiaries offer to unaffiliated parties that are similarly situated.
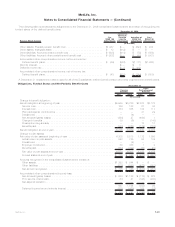
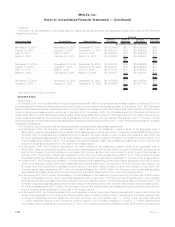
The weighted-average allocations of pension plan and other postretirement benefit plan assets were as follows:
2007 2006 2007 2006
Pension
Benefits
Other
Postretirement
Benefits
December 31,
Asset Category
Equitysecurities................................................... 38% 42% 37% 37%
Fixedmaturitysecurities.............................................. 44% 42% 58% 57%
Other(RealEstateandAlternativeInvestments)............................... 18% 16% 5% 6%
Total ....................................................... 100% 100% 100% 100%
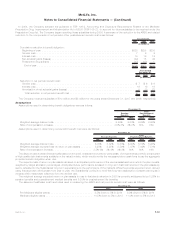
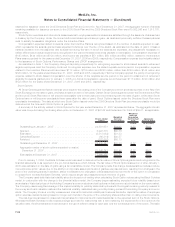
The weighted-average target allocations of pension plan and other postretirement benefit plan assets for 2008 are as follows:
Pension Other
Asset Category
Equitysecurities......................................................... 30%-55% 30%-45%
Fixedmaturitysecurities.................................................... 30%-65% 45%-70%
Other(RealEstateandAlternativeInvestments)..................................... 10%-25% 0%-10%
Target allocations of assets are determined with the objective of maximizing returns and minimizing volatility of net assets through
adequate asset diversification. Adjustments are made to target allocations based on an assessment of the impact of economic factors and
market conditions.
Cash Flows
It is the Subsidiaries’ practice to make contributions to the qualified pension plans to comply with minimum funding requirements of the
Employee Retirement Income Security Act of 1974, as amended. In accordance with such practice, no contributions were required for the
years ended December 31, 2007 or 2006. No contributions will be required for 2008. The Subsidiaries did not make discretionary
contributions to the qualified pension plans during the year ended December 31, 2007 and made contributions of $350 million during the
year ended December 31, 2006. The Subsidiaries expect to make additional discretionary contributions of $150 million in 2008.
Benefit payments due under the non-qualified pension plans are funded from the Subsidiaries’ general assets as they become due
under the provision of the plans. These payments totaled $50 million and $38 million for the years ended December 31, 2007 and 2006,
respectively. These payments are expected to be at approximately the same level in 2008.
Other postretirement benefits represent a non-vested, non-guaranteed obligation of the Subsidiaries and current regulations do not
require specific funding levels for these benefits. While the Subsidiaries have partially funded such plans in advance, it has been the
Subsidiaries’ practice to primarily use their general assets, net of participant’s contributions, to pay postretirement medical claims as they
come due in lieu of utilizing plan assets. Total payments equaled $174 million and $152 million for the years ended December 31, 2007 and
2006, respectively.
The Subsidiaries’ expect to make contributions of $116 million, net of participant’s contributions, towards the other postretirement plan
obligations in 2008. As noted previously, the Subsidiaries expect to receive subsidies under the Prescription Drug Act to partially offset
such payments.
F-64 MetLife, Inc.
MetLife, Inc.
Notes to Consolidated Financial Statements — (Continued)