MetLife 2007 Annual Report Download - page 88
Download and view the complete annual report
Please find page 88 of the 2007 MetLife annual report below. You can navigate through the pages in the report by either clicking on the pages listed below, or by using the keyword search tool below to find specific information within the annual report.-
 1
1 -
2
-
3
-
4
-
5
-
6
-
7
-
8
-
9
-
10
-
11
-
12
-
13
-
14
-
15
-
16
-
17
-
18
-
19
-
20
-
21
-
22
-
23
-
24
-
25
-
26
-
27
-
28
-
29
-
30
-
31
-
32
-
33
-
34
-
35
-
36
-
37
-
38
-
39
-
40
-
41
-
42
-
43
-
44
-
45
-
46
-
47
-
48
-
49
-
50
-
51
-
52
-
53
-
54
-
55
-
56
-
57
-
58
-
59
-
60
-
61
-
62
-
63
-
64
-
65
-
66
-
67
-
68
-
69
-
70
-
71
-
72
-
73
-
74
-
75
-
76
-
77
-
 78
78 -
 79
79 -
 80
80 -
 81
81 -
 82
82 -
 83
83 -
 84
84 -
 85
85 -
 86
86 -
 87
87 -
 88
88 -
 89
89 -
 90
90 -
 91
91 -
 92
92 -
 93
93 -
 94
94 -
 95
95 -
 96
96 -
 97
97 -
 98
98 -
99
-
100
-
101
-
102
-
103
-
104
-
105
-
106
-
107
-
108
-
109
-
110
-
111
-
112
-
113
-
114
-
115
-
116
-
117
-
118
-
119
-
120
-
121
-
122
-
123
-
124
-
125
-
126
-
127
-
128
-
129
-
130
-
131
-
132
-
133
-
134
-
135
-
136
-
137
-
138
-
139
-
140
-
141
-
142
-
143
-
144
-
145
-
146
-
147
-
148
-
149
-
150
-
151
-
152
-
153
-
154
-
155
-
156
-
157
-
158
-
159
-
160
-
161
-
162
-
163
-
164
-
165
-
166
-
167
-
168
-
169
-
170
-
171
-
172
-
173
-
174
-
175
-
176
-
177
-
178
-
179
-
180
-
181
-
182
-
183
-
184
 |
 |

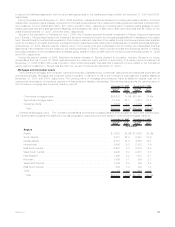
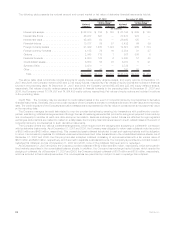
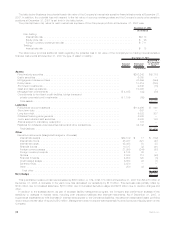
The following table presents the notional amount and current market or fair value of derivative financial instruments held at:
Notional
Amount Assets Liabilities Notional
Amount Assets Liabilities
Current Market
or Fair Value Current Market
or Fair Value
December 31, 2007 December 31, 2006
(In millions)
Interest rate swaps . . . . . . . . . . . . . . . . . . . . . . $ 62,519 $ 785 $ 768 $ 27,148 $ 639 $ 150
Interestratefloors ...................... 48,937 621 — 37,437 279 —
Interestratecaps....................... 45,498 50 — 26,468 125 —
Financialfutures ....................... 10,817 89 57 8,432 64 39
Foreign currency swaps . . . . . . . . . . . . . . . . . . 21,399 1,480 1,724 19,627 986 1,174
Foreign currency forwards . . . . . . . . . . . . . . . . . 4,185 76 16 2,934 31 27
Options............................. 2,043 713 1 587 306 8
Financialforwards ...................... 4,600 122 2 3,800 12 40
Creditdefaultswaps..................... 6,850 58 35 6,357 5 21
SyntheticGICs ........................ 3,670 — — 3,739 — —
Other............................... 250 43 — 250 56 —
Total.............................. $210,768 $4,037 $2,603 $136,779 $2,503 $1,459
The above table does not include notional amounts for equity futures, equity variance swaps, and equity options. At December 31,
2007 and 2006, the Company owned 4,658 and 2,749 equity futures, respectively. Fair values of equity futures are included in financial
futures in the preceding table. At December 31, 2007 and 2006, the Company owned 695,485 and 225,000 equity variance swaps,
respectively. Fair values of equity variance swaps are included in financial forwards in the preceding table. At December 31, 2007 and
2006, the Company owned 77,374,937 and 74,864,483 equity options, respectively. Fair values of equity options are included in options
in the preceding table.
Credit Risk. The Company may be exposed to credit-related losses in the event of nonperformance by counterparties to derivative
financial instruments. Generally, the current credit exposure of the Company’s derivative contracts is limited to the fair value at the reporting
date. The credit exposure of the Company’s derivative transactions is represented by the fair value of contracts with a net positive fair value
at the reporting date.
The Company manages its credit risk related to over-the-counter derivatives by entering into transactions with creditworthy counter-
parties, maintaining collateral arrangements and through the use of master agreements that provide for a single net payment to be made by
one counterparty to another at each due date and upon termination. Because exchange traded futures are effected through regulated
exchanges, and positions are marked to market on a daily basis, the Company has minimal exposure to credit-related losses in the event of
nonperformance by counterparties to such derivative instruments.
The Company enters into various collateral arrangements, which require both the pledging and accepting of collateral in connection
with its derivative instruments. As of December 31, 2007 and 2006, the Company was obligated to return cash collateral under its control
of $833 million and $428 million, respectively. This unrestricted cash collateral is included in cash and cash equivalents and the obligation
to return it is included in payables for collateral under securities loaned and other transactions in the consolidated balance sheets. As of
December 31, 2007 and 2006, the Company had also accepted collateral consisting of various securities with a fair market value of
$678 million and $453 million, respectively, which are held in separate custodial accounts. The Company is permitted by contract to sell or
repledge this collateral, but as of December 31, 2007 and 2006, none of the collateral had been sold or repledged.
As of December 31, 2007 and 2006, the Company provided collateral of $162 million and $80 million, respectively, which is included in
fixed maturity securities in the consolidated balance sheets. In addition, the Company has exchange traded futures, which require the
pledging of collateral. As of December 31, 2007 and 2006, the Company pledged collateral of $167 million and $105 million, respectively,
which is included in fixed maturity securities. The counterparties are permitted by contract to sell or repledge this collateral.
84 MetLife, Inc.