MetLife 2007 Annual Report Download - page 170
Download and view the complete annual report
Please find page 170 of the 2007 MetLife annual report below. You can navigate through the pages in the report by either clicking on the pages listed below, or by using the keyword search tool below to find specific information within the annual report.-
 1
1 -
2
-
3
-
4
-
5
-
6
-
7
-
8
-
9
-
10
-
11
-
12
-
13
-
14
-
15
-
16
-
17
-
18
-
19
-
20
-
21
-
22
-
23
-
24
-
25
-
26
-
27
-
28
-
29
-
30
-
31
-
32
-
33
-
34
-
35
-
36
-
37
-
38
-
39
-
40
-
41
-
42
-
43
-
44
-
45
-
46
-
47
-
48
-
49
-
50
-
51
-
52
-
53
-
54
-
55
-
56
-
57
-
58
-
59
-
60
-
61
-
62
-
63
-
64
-
65
-
66
-
67
-
68
-
69
-
70
-
71
-
72
-
73
-
74
-
75
-
76
-
77
-
78
-
79
-
80
-
81
-
82
-
83
-
84
-
85
-
86
-
87
-
88
-
89
-
90
-
91
-
92
-
93
-
94
-
95
-
96
-
97
-
98
-
99
-
100
-
101
-
102
-
103
-
104
-
105
-
106
-
107
-
108
-
109
-
110
-
111
-
112
-
113
-
114
-
115
-
116
-
117
-
118
-
119
-
120
-
121
-
122
-
123
-
124
-
125
-
126
-
127
-
128
-
129
-
130
-
131
-
132
-
133
-
134
-
135
-
136
-
137
-
138
-
139
-
140
-
141
-
142
-
143
-
144
-
145
-
146
-
147
-
148
-
149
-
150
-
151
-
152
-
153
-
154
-
155
-
156
-
157
-
158
-
159
-
 160
160 -
 161
161 -
 162
162 -
 163
163 -
 164
164 -
 165
165 -
 166
166 -
 167
167 -
 168
168 -
 169
169 -
 170
170 -
 171
171 -
 172
172 -
 173
173 -
 174
174 -
 175
175 -
 176
176 -
 177
177 -
 178
178 -
 179
179 -
 180
180 -
181
-
182
-
183
-
184
 |
 |

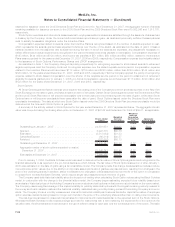
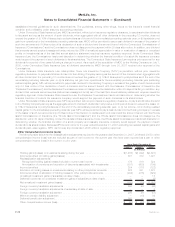
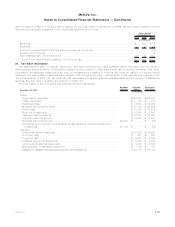
21. Quarterly Results of Operations (Unaudited)
The unaudited quarterly results of operations for 2007 and 2006 are summarized in the table below:
March 31, June 30, September 30, December 31,
Three Months Ended
(In millions, except per share data)
2007
Totalrevenues ............................................. $12,908 $13,216 $13,053 $13,830
Totalexpenses............................................. $11,469 $11,586 $11,668 $12,245
Incomefromcontinuingoperations................................ $ 1,024 $ 1,154 $ 984 $ 1,118
Income (loss) from discontinued operations, net of income tax . . . . . . . . . . . . . . $ (7) $ 9 $ 35 $ —
Netincome ............................................... $ 1,017 $ 1,163 $ 1,019 $ 1,118
Netincomeavailabletocommonshareholders ........................ $ 983 $ 1,129 $ 985 $ 1,083
Basic earnings per share:
Income from continuing operations available to common shareholders . . . . . . . . $ 1.32 $ 1.50 $ 1.28 $ 1.47
Income from discontinued operations, net of income tax, per common share . . . $ (0.01) $ 0.01 $ 0.05 $ —
Netincome.............................................. $ 1.35 $ 1.56 $ 1.37 $ 1.52
Net income available to common shareholders, per common share . . . . . . . . . . $ 1.31 $ 1.52 $ 1.32 $ 1.47
Diluted earnings per share:
Income from continuing operations available to common shareholders . . . . . . . . $ 1.29 $ 1.47 $ 1.25 $ 1.44
Income from discontinued operations, net of income tax, per common share . . . $ (0.01) $ 0.01 $ 0.05 $ —
Netincome.............................................. $ 1.32 $ 1.52 $ 1.34 $ 1.48
Net income available to common shareholders, per common share . . . . . . . . . . $ 1.28 $ 1.48 $ 1.29 $ 1.44
2006
Totalrevenues ............................................. $11,528 $11,350 $12,525 $12,851
Totalexpenses............................................. $10,518 $10,553 $11,212 $11,803
Incomefromcontinuingoperations................................ $ 727 $ 592 $ 958 $ 794
Incomefromdiscontinuedoperations,netofincometax.................. $ 20 $ 58 $ 75 $ 3,069
Netincome ............................................... $ 747 $ 650 $ 1,033 $ 3,863
Netincomeavailabletocommonshareholders ........................ $ 714 $ 617 $ 999 $ 3,829
Basic earnings per share:
Income from continuing operations available to common shareholders . . . . . . . . $ 0.91 $ 0.73 $ 1.21 $ 1.00
Income from discontinued operations, net of income tax, per common share . . . $ 0.03 $ 0.08 $ 0.10 $ 4.03
Netincome.............................................. $ 0.98 $ 0.85 $ 1.35 $ 5.09
Net income available to common shareholders, per common share . . . . . . . . . . $ 0.94 $ 0.81 $ 1.31 $ 5.04
Diluted earnings per share:
Income from continuing operations available to common shareholders . . . . . . . . $ 0.90 $ 0.73 $ 1.19 $ 0.99
Income from discontinued operations, net of income tax, per common share . . . $ 0.03 $ 0.08 $ 0.10 $ 3.98
Netincome.............................................. $ 0.97 $ 0.84 $ 1.34 $ 5.00
Net income available to common shareholders, per common share . . . . . . . . . . $ 0.93 $ 0.80 $ 1.29 $ 4.95
22. Business Segment Information
The Company is a leading provider of insurance and other financial services with operations throughout the United States and the
regions of Latin America, Europe, and Asia Pacific. The Company’s business is divided into five operating segments: Institutional,
Individual, Auto & Home, International and Reinsurance, as well as Corporate & Other. These segments are managed separately because
they either provide different products and services, require different strategies or have different technology requirements.
Institutional offers a broad range of group insurance and retirement & savings products and services, including group life insurance,
non-medical health insurance, such as short and long-term disability, long-term care, and dental insurance, and other insurance products
and services. Individual offers a wide variety of protection and asset accumulation products, including life insurance, annuities and mutual
funds. Auto & Home provides personal lines property and casualty insurance, including private passenger automobile, homeowners and
personal excess liability insurance. International provides life insurance, accident and health insurance, annuities and retirement & savings
products to both individuals and groups. Through the Company’s majority-owned subsidiary, RGA, the Reinsurance segment provides
reinsurance of life and annuity policies in North America and various international markets. Additionally, reinsurance of critical illness
policies is provided in select international markets.
F-74 MetLife, Inc.
MetLife, Inc.
Notes to Consolidated Financial Statements — (Continued)