MetLife 2007 Annual Report Download - page 135
Download and view the complete annual report
Please find page 135 of the 2007 MetLife annual report below. You can navigate through the pages in the report by either clicking on the pages listed below, or by using the keyword search tool below to find specific information within the annual report.-
 1
1 -
2
-
3
-
4
-
5
-
6
-
7
-
8
-
9
-
10
-
11
-
12
-
13
-
14
-
15
-
16
-
17
-
18
-
19
-
20
-
21
-
22
-
23
-
24
-
25
-
26
-
27
-
28
-
29
-
30
-
31
-
32
-
33
-
34
-
35
-
36
-
37
-
38
-
39
-
40
-
41
-
42
-
43
-
44
-
45
-
46
-
47
-
48
-
49
-
50
-
51
-
52
-
53
-
54
-
55
-
56
-
57
-
58
-
59
-
60
-
61
-
62
-
63
-
64
-
65
-
66
-
67
-
68
-
69
-
70
-
71
-
72
-
73
-
74
-
75
-
76
-
77
-
78
-
79
-
80
-
81
-
82
-
83
-
84
-
85
-
86
-
87
-
88
-
89
-
90
-
91
-
92
-
93
-
94
-
95
-
96
-
97
-
98
-
99
-
100
-
101
-
102
-
103
-
104
-
105
-
106
-
107
-
108
-
109
-
110
-
111
-
112
-
113
-
114
-
115
-
116
-
117
-
118
-
119
-
120
-
121
-
122
-
123
-
124
-
 125
125 -
 126
126 -
 127
127 -
 128
128 -
 129
129 -
 130
130 -
 131
131 -
 132
132 -
 133
133 -
 134
134 -
 135
135 -
 136
136 -
 137
137 -
 138
138 -
 139
139 -
 140
140 -
 141
141 -
 142
142 -
 143
143 -
 144
144 -
 145
145 -
146
-
147
-
148
-
149
-
150
-
151
-
152
-
153
-
154
-
155
-
156
-
157
-
158
-
159
-
160
-
161
-
162
-
163
-
164
-
165
-
166
-
167
-
168
-
169
-
170
-
171
-
172
-
173
-
174
-
175
-
176
-
177
-
178
-
179
-
180
-
181
-
182
-
183
-
184
 |
 |

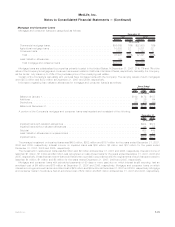
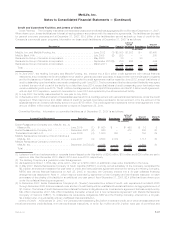
7. Insurance
Insurance Liabilities
Insurance liabilities are as follows:
2007 2006 2007 2006 2007 2006
Future Policy
Benefits Policyholder Account
Balances Other Policyholder
Funds
December 31,
(In millions)
Institutional
Grouplife............................. $ 3,326 $ 3,252 $ 13,997 $ 13,567 $ 2,364 $2,259
Retirement & savings . . . . . . . . . . . . . . . . . . . . . 37,947 37,908 51,585 46,127 213 21
Non-medical health & other . . . . . . . . . . . . . . . . . 10,617 9,540 501 — 597 531
Individual
Traditionallife.......................... 52,493 51,715 1 1 1,479 1,429
Universal variable life . . . . . . . . . . . . . . . . . . . . . 985 894 14,898 14,544 1,572 1,367
Annuities............................. 3,063 3,186 37,807 40,251 76 43
Other ............................... — — 2,410 2,412 1 1
Auto&Home............................ 3,273 3,392 — — 51 61
International ............................ 9,826 8,123 4,961 4,198 1,296 1,223
Reinsurance ............................ 6,159 5,140 6,657 6,212 2,297 1,980
CorporateandOther....................... 4,573 4,339 4,532 4,636 230 224
Total................................ $132,262 $127,489 $137,349 $131,948 $10,176 $9,139
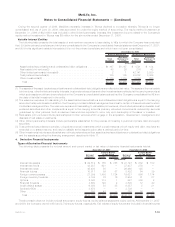
Value of Distribution Agreements and Customer Relationships Acquired
Information regarding the VODA and VOCRA, which are reported in other assets, is as follows:
2007 2006 2005
Years Ended
December 31,
(In millions)
BalanceatJanuary1,...................................................... $708 $715 $ —
Acquisitions ............................................................ 11 — 716
Amortization ............................................................ (16) (6) (1)
Other................................................................. 3 (1) —
BalanceatDecember31, ................................................... $706 $708 $715
The estimated future amortization expense allocated to other expenses for the next five years for VODA and VOCRA is $23 million in
2008, $28 million in 2009, $34 million in 2010, $37 million in 2011 and $42 million in 2012. See Note 2 for a description of acquisitions and
dispositions.
Sales Inducements
Information regarding deferred sales inducements, which are reported in other assets, is as follows:
2007 2006 2005
Years Ended
December 31,
(In millions)
BalanceatJanuary1,...................................................... $578 $414 $294
Capitalization ........................................................... 181 194 140
Amortization ............................................................ (82) (30) (20)
BalanceatDecember31, ................................................... $677 $578 $414
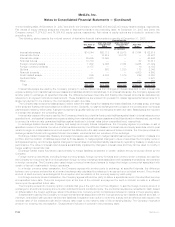
Separate Accounts
Separate account assets and liabilities include two categories of account types: pass-through separate accounts totaling $141.8 billion
and $127.9 billion at December 31, 2007 and 2006, respectively, for which the policyholder assumes all investment risk, and separate
accounts with a minimum return or account value for which the Company contractually guarantees either a minimum return or account
value to the policyholder which totaled $18.4 billion and $16.5 billion at December 31, 2007 and 2006, respectively. The latter category
consisted primarily of Met Managed GICs and participating close-out contracts. The average interest rate credited on these contracts was
4.73% and 4.63% at December 31, 2007 and 2006, respectively.
Fees charged to the separate accounts by the Company (including mortality charges, policy administration fees and surrender charges)
are reflected in the Company’s revenues as universal life and investment-type product policy fees and totaled $2.8 billion, $2.4 billion and
$1.7 billion for the years ended December 31, 2007, 2006 and 2005, respectively.
F-39MetLife, Inc.
MetLife, Inc.
Notes to Consolidated Financial Statements — (Continued)