MetLife 2007 Annual Report Download - page 80
Download and view the complete annual report
Please find page 80 of the 2007 MetLife annual report below. You can navigate through the pages in the report by either clicking on the pages listed below, or by using the keyword search tool below to find specific information within the annual report.-
 1
1 -
2
-
3
-
4
-
5
-
6
-
7
-
8
-
9
-
10
-
11
-
12
-
13
-
14
-
15
-
16
-
17
-
18
-
19
-
20
-
21
-
22
-
23
-
24
-
25
-
26
-
27
-
28
-
29
-
30
-
31
-
32
-
33
-
34
-
35
-
36
-
37
-
38
-
39
-
40
-
41
-
42
-
43
-
44
-
45
-
46
-
47
-
48
-
49
-
50
-
51
-
52
-
53
-
54
-
55
-
56
-
57
-
58
-
59
-
60
-
61
-
62
-
63
-
64
-
65
-
66
-
67
-
68
-
69
-
 70
70 -
 71
71 -
 72
72 -
 73
73 -
 74
74 -
 75
75 -
 76
76 -
 77
77 -
 78
78 -
 79
79 -
 80
80 -
 81
81 -
 82
82 -
 83
83 -
 84
84 -
 85
85 -
 86
86 -
 87
87 -
 88
88 -
 89
89 -
 90
90 -
91
-
92
-
93
-
94
-
95
-
96
-
97
-
98
-
99
-
100
-
101
-
102
-
103
-
104
-
105
-
106
-
107
-
108
-
109
-
110
-
111
-
112
-
113
-
114
-
115
-
116
-
117
-
118
-
119
-
120
-
121
-
122
-
123
-
124
-
125
-
126
-
127
-
128
-
129
-
130
-
131
-
132
-
133
-
134
-
135
-
136
-
137
-
138
-
139
-
140
-
141
-
142
-
143
-
144
-
145
-
146
-
147
-
148
-
149
-
150
-
151
-
152
-
153
-
154
-
155
-
156
-
157
-
158
-
159
-
160
-
161
-
162
-
163
-
164
-
165
-
166
-
167
-
168
-
169
-
170
-
171
-
172
-
173
-
174
-
175
-
176
-
177
-
178
-
179
-
180
-
181
-
182
-
183
-
184
 |
 |

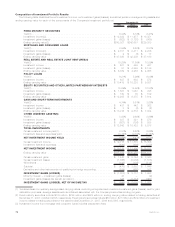
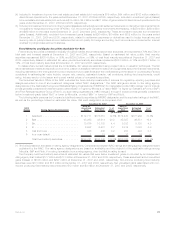
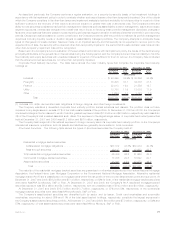
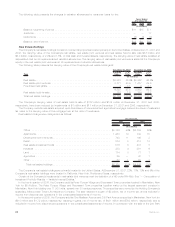
The following tables present the cost or amortized cost, gross unrealized loss and number of securities for fixed maturity and equity
securities, where the estimated fair value had declined and remained below cost or amortized cost by less than 20%, or 20% or more at:
Less than
20% 20% or
more Less than
20% 20% or
more Less than
20% 20% or
more
Cost or Amortized Cost Gross Unrealized
Loss Number of
Securities
December 31, 2007
(In millions, except number of securities)
Lessthansixmonths ................................... $ 49,463 $1,943 $1,670 $555 6,339 644
Sixmonthsorgreaterbutlessthanninemonths.................. 17,353 23 844 7 1,461 31
Ninemonthsorgreaterbutlessthantwelvemonths ............... 9,410 7 568 2 791 1
Twelvemonthsorgreater................................. 31,731 50 1,262 13 3,192 32
Total ........................................ $107,957 $2,023 $4,344 $577
Less than
20% 20% or
more Less than
20% 20% or
more Less than
20% 20% or
more
Cost or Amortized
Cost Gross Unrealized
Loss Number of
Securities
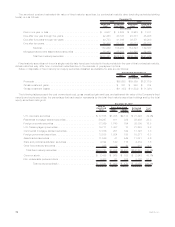
December 31, 2006
(In millions, except number of securities)
Lessthansixmonths .................................. $ 52,222 $35 $ 547 $12 9,093 81
Sixmonthsorgreaterbutlessthanninemonths................. 2,682 3 42 1 415 2
Ninemonthsorgreaterbutlessthantwelvemonths .............. 12,049 14 204 4 937 1
Twelvemonthsorgreater................................ 47,462 29 1,511 7 4,634 6
Total........................................ $114,415 $81 $2,304 $24
At December 31, 2007 and 2006, $4.3 billion and $2.3 billion, respectively, of unrealized losses related to securities with an unrealized
loss position of less than 20% of cost or amortized cost, which represented 4% and 2%, respectively, of the cost or amortized cost of such
securities.
At December 31, 2007, $577 million of unrealized losses related to securities with an unrealized loss position of 20% or more of cost or
amortized cost, which represented 29% of the cost or amortized cost of such securities. Of such unrealized losses of $577 million,
$555 million related to securities that were in an unrealized loss position for a period of less than six months. At December 31, 2006,
$24 million of unrealized losses related to securities with an unrealized loss position of 20% or more of cost or amortized cost, which
represented 30% of the cost or amortized cost of such securities. Of such unrealized losses of $24 million, $12 million related to securities
that were in an unrealized loss position for a period of less than six months.
The Company held 30 fixed maturity and equity securities, each with a gross unrealized loss at December 31, 2007 of greater than
$10 million. These securities represented 9%, or $459 million in the aggregate, of the gross unrealized loss on fixed maturity and equity
securities. The Company held eight fixed maturity and equity securities, each with a gross unrealized loss at December 31, 2006 of greater
than $10 million. These securities represented 7%, or $169 million in the aggregate, of the gross unrealized loss on fixed maturity and
equity securities.
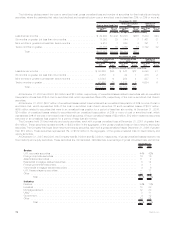
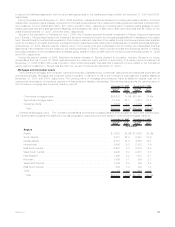
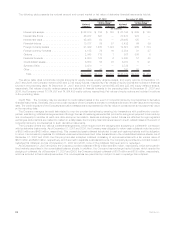
At December 31, 2007 and 2006, the Company had $4.9 billion and $2.3 billion, respectively, of gross unrealized losses related to its
fixed maturity and equity securities. These securities are concentrated, calculated as a percentage of gross unrealized loss, as follows:
2007 2006
December 31,
Sector:
U.S.corporatesecurities ..................................................... 44% 42%
Foreigncorporatesecurities ................................................... 16 16
Asset-backedsecurities...................................................... 11 2
Residentialmortgage-backedsecurities............................................ 8 14
Foreigngovernmentsecurities.................................................. 4 1
Commercialmortgage-backedsecurities ........................................... 4 6
U.S.Treasury/agencysecurities................................................. — 11
Other.................................................................. 13 8
Total............................................................. 100% 100%
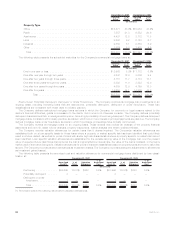
Industry:
Finance................................................................. 34% 10%
Industrial................................................................ 18 23
Mortgage-backed.......................................................... 12 20
Utility .................................................................. 8 11
Government.............................................................. 4 12
Other.................................................................. 24 24
Total............................................................. 100% 100%
76 MetLife, Inc.