MetLife 2007 Annual Report Download - page 173
Download and view the complete annual report
Please find page 173 of the 2007 MetLife annual report below. You can navigate through the pages in the report by either clicking on the pages listed below, or by using the keyword search tool below to find specific information within the annual report.-
 1
1 -
2
-
3
-
4
-
5
-
6
-
7
-
8
-
9
-
10
-
11
-
12
-
13
-
14
-
15
-
16
-
17
-
18
-
19
-
20
-
21
-
22
-
23
-
24
-
25
-
26
-
27
-
28
-
29
-
30
-
31
-
32
-
33
-
34
-
35
-
36
-
37
-
38
-
39
-
40
-
41
-
42
-
43
-
44
-
45
-
46
-
47
-
48
-
49
-
50
-
51
-
52
-
53
-
54
-
55
-
56
-
57
-
58
-
59
-
60
-
61
-
62
-
63
-
64
-
65
-
66
-
67
-
68
-
69
-
70
-
71
-
72
-
73
-
74
-
75
-
76
-
77
-
78
-
79
-
80
-
81
-
82
-
83
-
84
-
85
-
86
-
87
-
88
-
89
-
90
-
91
-
92
-
93
-
94
-
95
-
96
-
97
-
98
-
99
-
100
-
101
-
102
-
103
-
104
-
105
-
106
-
107
-
108
-
109
-
110
-
111
-
112
-
113
-
114
-
115
-
116
-
117
-
118
-
119
-
120
-
121
-
122
-
123
-
124
-
125
-
126
-
127
-
128
-
129
-
130
-
131
-
132
-
133
-
134
-
135
-
136
-
137
-
138
-
139
-
140
-
141
-
142
-
143
-
144
-
145
-
146
-
147
-
148
-
149
-
150
-
151
-
152
-
153
-
154
-
155
-
156
-
157
-
158
-
159
-
160
-
161
-
162
-
 163
163 -
 164
164 -
 165
165 -
 166
166 -
 167
167 -
 168
168 -
 169
169 -
 170
170 -
 171
171 -
 172
172 -
 173
173 -
 174
174 -
 175
175 -
 176
176 -
 177
177 -
 178
178 -
 179
179 -
 180
180 -
 181
181 -
 182
182 -
 183
183 -
184
 |
 |

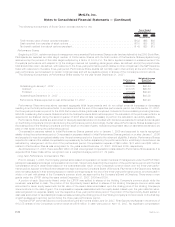
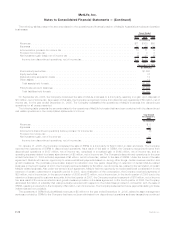
23. Discontinued Operations
Real Estate
The Company actively manages its real estate portfolio with the objective of maximizing earnings through selective acquisitions and
dispositions. Income related to real estate classified as held-for-sale or sold is presented in discontinued operations. These assets are
carried at the lower of depreciated cost or fair value less expected disposition costs.
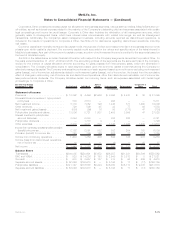
The following information presents the components of income from discontinued real estate operations:
2007 2006 2005
Years Ended December 31,
(In millions)
Investmentincome...................................................... $59 $ 276 $ 435
Investmentexpense..................................................... (43) (182) (273)
Netinvestmentgains .................................................... 13 4,795 2,125
Totalrevenues....................................................... 29 4,889 2,287
Provisionforincometax .................................................. 11 1,727 813
Incomefromdiscontinuedoperations,netofincometax ............................. $18 $3,162 $1,474
The carrying value of real estate related to discontinued operations was $172 million and $184 million at December 31, 2007 and 2006,
respectively.
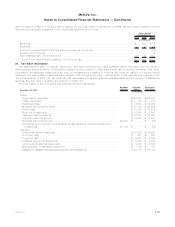
The following table presents the discontinued real estate operations by segment:
2007 2006 2005
Years Ended December 31,
(In millions)
Net investment income
Institutional ......................................................... $ 4 $ 8 $ 29
Individual........................................................... 1 4 20
Corporate&Other..................................................... 11 82 113
Totalnetinvestmentincome............................................. $16 $ 94 $ 162
Net investment gains (losses)
Institutional ......................................................... $12 $ 58 $ 242
Individual........................................................... — 23 443
Corporate&Other..................................................... 1 4,714 1,440
Totalnetinvestmentgains(losses)......................................... $13 $4,795 $2,125
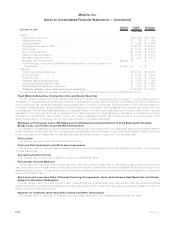
In the fourth quarter of 2006, the Company sold its Peter Cooper Village and Stuyvesant Town properties located in Manhattan, New
York for $5.4 billion. The Peter Cooper Village and Stuyvesant Town properties together make up the largest apartment complex in
Manhattan, New York totaling over 11,000 units, spread over 80 contiguous acres. The properties were owned by the Company’s
subsidiary, MTL. Net investment income on these properties was $73 million and $72 million for the years ended December 31, 2006 and
2005, respectively. The sale resulted in a gain of $3 billion, net of income tax.
In the second quarter of 2005, the Company sold its One Madison Avenue and 200 Park Avenue properties in Manhattan, New York for
$918 million and $1.72 billion, respectively, resulting in gains, net of income tax, of $431 million and $762 million, respectively. Net
investment income on One Madison Avenue and 200 Park Avenue was $13 million and $44 million, for the year ended December 31, 2005,
respectively. In connection with the sale of the 200 Park Avenue property, the Company has retained rights to existing signage and is
leasing space for associates in the property for 20 years with optional renewal periods through 2205.
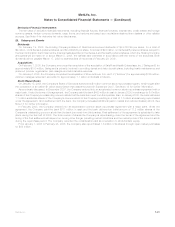
Operations
On August 31, 2007, MetLife Australia completed the sale of its annuities and pension businesses to a third party for $25 million in cash
consideration resulting in a gain upon disposal of $41 million, net of income tax, which was adjusted in the fourth quarter of 2007 for
additional transaction costs. The Company reclassified the assets and liabilities of the annuities and pension businesses within MetLife
Australia, which is reported in the International segment, to assets and liabilities of subsidiaries held-for-sale and the operations of the
business to discontinued operations for all periods presented. Included within the assets to be sold were certain fixed maturity securities in
a loss position for which the Company recognized a net investment loss on a consolidated basis of $59 million, net of income tax, for the
year ended December 31, 2007, because the Company no longer had the intent to hold such securities.
F-77MetLife, Inc.
MetLife, Inc.
Notes to Consolidated Financial Statements — (Continued)