MetLife 2007 Annual Report Download - page 7
Download and view the complete annual report
Please find page 7 of the 2007 MetLife annual report below. You can navigate through the pages in the report by either clicking on the pages listed below, or by using the keyword search tool below to find specific information within the annual report.-
 1
1 -
 2
2 -
 3
3 -
 4
4 -
 5
5 -
 6
6 -
 7
7 -
 8
8 -
 9
9 -
 10
10 -
 11
11 -
 12
12 -
 13
13 -
 14
14 -
 15
15 -
 16
16 -
 17
17 -
 18
18 -
19
-
20
-
21
-
22
-
23
-
24
-
25
-
26
-
27
-
28
-
29
-
30
-
31
-
32
-
33
-
34
-
35
-
36
-
37
-
38
-
39
-
40
-
41
-
42
-
43
-
44
-
45
-
46
-
47
-
48
-
49
-
50
-
51
-
52
-
53
-
54
-
55
-
56
-
57
-
58
-
59
-
60
-
61
-
62
-
63
-
64
-
65
-
66
-
67
-
68
-
69
-
70
-
71
-
72
-
73
-
74
-
75
-
76
-
77
-
78
-
79
-
80
-
81
-
82
-
83
-
84
-
85
-
86
-
87
-
88
-
89
-
90
-
91
-
92
-
93
-
94
-
95
-
96
-
97
-
98
-
99
-
100
-
101
-
102
-
103
-
104
-
105
-
106
-
107
-
108
-
109
-
110
-
111
-
112
-
113
-
114
-
115
-
116
-
117
-
118
-
119
-
120
-
121
-
122
-
123
-
124
-
125
-
126
-
127
-
128
-
129
-
130
-
131
-
132
-
133
-
134
-
135
-
136
-
137
-
138
-
139
-
140
-
141
-
142
-
143
-
144
-
145
-
146
-
147
-
148
-
149
-
150
-
151
-
152
-
153
-
154
-
155
-
156
-
157
-
158
-
159
-
160
-
161
-
162
-
163
-
164
-
165
-
166
-
167
-
168
-
169
-
170
-
171
-
172
-
173
-
174
-
175
-
176
-
177
-
178
-
179
-
180
-
181
-
182
-
183
-
184
 |
 |

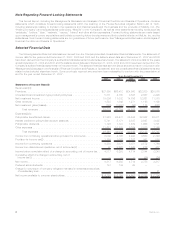
2007 2006 2005 2004 2003
December 31,
(In millions)
Balance Sheet Data(1)
Assets:
Generalaccountassets............................... $398,403 $383,350 $353,776 $270,039 $251,085
Separate account assets . . . . . . . . . . . . . . . . . . . . . . . . . . . . . . 160,159 144,365 127,869 86,769 75,756
Totalassets(2).................................... $558,562 $527,715 $481,645 $356,808 $326,841
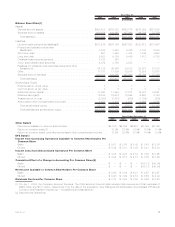
Liabilities:
Life and health policyholder liabilities(4) . . . . . . . . . . . . . . . . . . . . . $278,246 $267,146 $257,258 $193,612 $177,947
Property and casualty policyholder
liabilities(4)...................................... 3,324 3,453 3,490 3,180 2,943
Short-termdebt.................................... 667 1,449 1,414 1,445 3,642
Long-termdebt .................................... 9,628 9,129 9,489 7,412 5,703
Collateralfinancingarrangements......................... 5,732 850 — — —
Juniorsubordinateddebtsecurities ....................... 4,474 3,780 2,533 — —
Payables for collateral under securities loaned and other
transactions..................................... 44,136 45,846 34,515 28,678 27,083
Other........................................... 17,017 17,899 15,976 12,888 12,618
Separate account liabilities . . . . . . . . . . . . . . . . . . . . . . . . . . . . . 160,159 144,365 127,869 86,769 75,756
Total liabilities(2) . . . . . . . . . . . . . . . . . . . . . . . . . . . . . . . . . . 523,383 493,917 452,544 333,984 305,692
Stockholders’ Equity
Preferredstock,atparvalue............................ 1 1 1 — —
Commonstock,atparvalue............................88888
Additional paid-in capital . . . . . . . . . . . . . . . . . . . . . . . . . . . . . . 17,098 17,454 17,274 15,037 14,991
Retainedearnings(5)................................. 19,884 16,574 10,865 6,608 4,193
Treasurystock,atcost................................ (2,890) (1,357) (959) (1,785) (835)
Accumulated other comprehensive income(6) . . . . . . . . . . . . . . . . . 1,078 1,118 1,912 2,956 2,792
Totalstockholders’equity............................. 35,179 33,798 29,101 22,824 21,149
Total liabilities and stockholders’ equity . . . . . . . . . . . . . . . . . . . . $558,562 $527,715 $481,645 $356,808 $326,841
2007 2006 2005 2004 2003
Years Ended December 31,
Other Data(1)
Netincomeavailabletocommonshareholders......................... $4,180 $6,159 $4,651 $2,758 $2,196
Returnoncommonequity(7) .................................... 13.0% 21.9% 18.5% 12.5% 11.4%
Return on common equity, excluding accumulated other comprehensive income . . . 13.2% 22.6% 20.4% 14.4% 13.0%
EPS Data(1)
Income from Continuing Operations Available to Common Shareholders Per
Common Share
Basic ................................................... $ 5.57 $ 3.85 $ 4.02 $ 3.43 $ 2.36
Diluted .................................................. $ 5.44 $ 3.81 $ 3.98 $ 3.41 $ 2.34
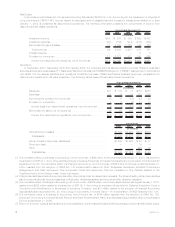
Income (loss) from Discontinued Operations Per Common Share
Basic ................................................... $ 0.05 $ 4.24 $ 2.19 $ 0.35 $ 0.65
Diluted .................................................. $ 0.04 $ 4.18 $ 2.18 $ 0.35 $ 0.64
Cumulative Effect of a Change in Accounting Per Common Share(3)
Basic ................................................... $ — $ — $ — $(0.11) $(0.04)
Diluted .................................................. $ — $ — $ — $(0.11) $(0.04)
Net Income Available to Common Shareholders Per Common Share
Basic ................................................... $ 5.62 $ 8.09 $ 6.21 $ 3.67 $ 2.97
Diluted .................................................. $ 5.48 $ 7.99 $ 6.16 $ 3.65 $ 2.94
Dividends Declared Per Common Share ........................... $ 0.74 $ 0.59 $ 0.52 $ 0.46 $ 0.23
(1) On July 1, 2005, the Company acquired Travelers. The 2005 selected financial data includes total revenues and total expenses of
$966 million and $577 million, respectively, from the date of the acquisition. See “Management’s Discussion and Analysis of Financial
Condition and Results of Operations — Acquisitions and Dispositions.”
(2) Discontinued Operations:
3MetLife, Inc.