MetLife 2007 Annual Report Download - page 36
Download and view the complete annual report
Please find page 36 of the 2007 MetLife annual report below. You can navigate through the pages in the report by either clicking on the pages listed below, or by using the keyword search tool below to find specific information within the annual report.-
 1
1 -
2
-
3
-
4
-
5
-
6
-
7
-
8
-
9
-
10
-
11
-
12
-
13
-
14
-
15
-
16
-
17
-
18
-
19
-
20
-
21
-
22
-
23
-
24
-
25
-
 26
26 -
 27
27 -
 28
28 -
 29
29 -
 30
30 -
 31
31 -
 32
32 -
 33
33 -
 34
34 -
 35
35 -
 36
36 -
 37
37 -
 38
38 -
 39
39 -
 40
40 -
 41
41 -
 42
42 -
 43
43 -
 44
44 -
 45
45 -
 46
46 -
47
-
48
-
49
-
50
-
51
-
52
-
53
-
54
-
55
-
56
-
57
-
58
-
59
-
60
-
61
-
62
-
63
-
64
-
65
-
66
-
67
-
68
-
69
-
70
-
71
-
72
-
73
-
74
-
75
-
76
-
77
-
78
-
79
-
80
-
81
-
82
-
83
-
84
-
85
-
86
-
87
-
88
-
89
-
90
-
91
-
92
-
93
-
94
-
95
-
96
-
97
-
98
-
99
-
100
-
101
-
102
-
103
-
104
-
105
-
106
-
107
-
108
-
109
-
110
-
111
-
112
-
113
-
114
-
115
-
116
-
117
-
118
-
119
-
120
-
121
-
122
-
123
-
124
-
125
-
126
-
127
-
128
-
129
-
130
-
131
-
132
-
133
-
134
-
135
-
136
-
137
-
138
-
139
-
140
-
141
-
142
-
143
-
144
-
145
-
146
-
147
-
148
-
149
-
150
-
151
-
152
-
153
-
154
-
155
-
156
-
157
-
158
-
159
-
160
-
161
-
162
-
163
-
164
-
165
-
166
-
167
-
168
-
169
-
170
-
171
-
172
-
173
-
174
-
175
-
176
-
177
-
178
-
179
-
180
-
181
-
182
-
183
-
184
 |
 |

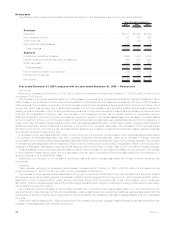
International
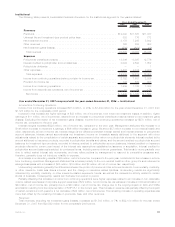
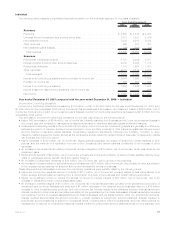
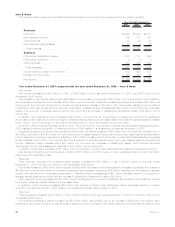
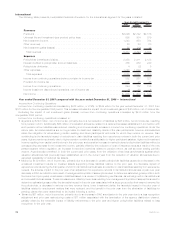
The following table presents consolidated financial information for the International segment for the years indicated:
2007 2006 2005
Years Ended December 31,
(In millions)
Revenues
Premiums ..................................................... $3,096 $2,722 $2,186
Universallifeandinvestment-typeproductpolicyfees......................... 995 804 579
Netinvestmentincome............................................. 1,248 950 794
Otherrevenues.................................................. 23 28 20
Netinvestmentgains(losses) ........................................ 55 (10) 12
Totalrevenues................................................. 5,417 4,494 3,591
Expenses
Policyholderbenefitsandclaims....................................... 2,458 2,411 2,128
Interestcreditedtopolicyholderaccountbalances........................... 355 289 240
Policyholderdividends............................................. 4 (2) 5
Otherexpenses ................................................. 1,748 1,529 997
Totalexpenses ................................................ 4,565 4,227 3,370
Incomefromcontinuingoperationsbeforeprovisionforincometax ................ 852 267 221
Provisionforincometax............................................ 208 95 35
Incomefromcontinuingoperations..................................... 644 172 186
Income(loss)fromdiscontinuedoperations,netofincometax................... (9) 28 6
Netincome.................................................... $ 635 $ 200 $ 192
Year ended December 31, 2007 compared with the year ended December 31, 2006 — International
Income from Continuing Operations
Income from continuing operations increased by $472 million, or 274%, to $644 million for the year ended December 31, 2007 from
$172 million for the comparable 2006 period. This increase includes the impact of net investment gains of $42 million, net of income tax.
Excluding the impact of net investment gains (losses), income from continuing operations increased by $430 million from the
comparable 2006 period.
Income from continuing operations increased in:
• Argentina by $146 million, net of income tax, primarily due to a net reduction of liabilities by $48 million, net of income tax, resulting
from pension reform. Additionally, $66 million of a valuation allowance related to a deferred tax asset established in connection with
such pension reform liabilities was reduced, resulting in a commensurate increase in income from continuing operations. Under the
reform plan, fund administrators are no longer liable for death and disability claims of the plan participants, however administrators
retain the obligation for administering certain existing and future participants’ accounts for which they receive no revenue. Also
contributing is the favorable impact of reductions in claim liabilities resulting from experience reviews in both the current and prior
years, higher premiums primarily due to higher pension contributions attributable to higher participant salaries, higher net investment
income resulting from capital contributions in the prior year, and a smaller increase in market indexed policyholder liabilities without a
corresponding decrease in net investment income, partially offset by the reduction of cost of insurance fees as a result of the new
pension system reform regulation, an increase in retention incentives related to pension reform, as well as lower trading portfolio
income. Argentina also benefited, in both the current and prior years, from the utilization of tax loss carryforwards against which
valuation allowances had previously been established, and in the current year from the reduction of valuation allowances due to
expected realizability of deferred tax assets.
• Mexico by $139 million, net of income tax, primarily due to a decrease in certain policyholder liabilities caused by a decrease in the
unrealized investment results on invested assets supporting those liabilities relative to the prior year, the favorable impact of
experience refunds during the first quarter of 2007 in its institutional business, a reduction in claim liabilities resulting from experience
reviews, the adverse impact in the prior year of an adjustment for experience refunds in its institutional business, a year over year
decrease in DAC amortization as a result of management’s update of assumptions used to determine estimated gross profits in both
the current and prior years, a decrease in liabilities based on a review of outstanding remittances, as well as growth in its institutional
and universal life businesses. These increases were offset by lower fees resulting from management’s update of assumptions used to
determine estimated gross profits, the favorable impact in the prior year associated with a large group policy that was not renewed by
the policyholder, a decrease in various one-time revenue items, lower investment yields, the favorable impact in the prior year of
liabilities related to employment matters that were reduced, and the benefit in the prior year from the elimination of liabilities for
pending claims that were determined to be invalid following a review.
• Taiwanby$51million,netofincometax,primarilyduetoanincreaseinDACamortizationintheprioryearduetoalossrecognition
adjustment and prior year restructuring costs of $11 million associated with the termination of the agency distribution channel,
partially offset by the favorable impact of liability refinements in the prior year and higher policyholder liabilities related to loss
recognitionintheprioryear.
32 MetLife, Inc.