MetLife 2007 Annual Report Download - page 31
Download and view the complete annual report
Please find page 31 of the 2007 MetLife annual report below. You can navigate through the pages in the report by either clicking on the pages listed below, or by using the keyword search tool below to find specific information within the annual report.-
 1
1 -
2
-
3
-
4
-
5
-
6
-
7
-
8
-
9
-
10
-
11
-
12
-
13
-
14
-
15
-
16
-
17
-
18
-
19
-
20
-
 21
21 -
 22
22 -
 23
23 -
 24
24 -
 25
25 -
 26
26 -
 27
27 -
 28
28 -
 29
29 -
 30
30 -
 31
31 -
 32
32 -
 33
33 -
 34
34 -
 35
35 -
 36
36 -
 37
37 -
 38
38 -
 39
39 -
 40
40 -
 41
41 -
42
-
43
-
44
-
45
-
46
-
47
-
48
-
49
-
50
-
51
-
52
-
53
-
54
-
55
-
56
-
57
-
58
-
59
-
60
-
61
-
62
-
63
-
64
-
65
-
66
-
67
-
68
-
69
-
70
-
71
-
72
-
73
-
74
-
75
-
76
-
77
-
78
-
79
-
80
-
81
-
82
-
83
-
84
-
85
-
86
-
87
-
88
-
89
-
90
-
91
-
92
-
93
-
94
-
95
-
96
-
97
-
98
-
99
-
100
-
101
-
102
-
103
-
104
-
105
-
106
-
107
-
108
-
109
-
110
-
111
-
112
-
113
-
114
-
115
-
116
-
117
-
118
-
119
-
120
-
121
-
122
-
123
-
124
-
125
-
126
-
127
-
128
-
129
-
130
-
131
-
132
-
133
-
134
-
135
-
136
-
137
-
138
-
139
-
140
-
141
-
142
-
143
-
144
-
145
-
146
-
147
-
148
-
149
-
150
-
151
-
152
-
153
-
154
-
155
-
156
-
157
-
158
-
159
-
160
-
161
-
162
-
163
-
164
-
165
-
166
-
167
-
168
-
169
-
170
-
171
-
172
-
173
-
174
-
175
-
176
-
177
-
178
-
179
-
180
-
181
-
182
-
183
-
184
 |
 |

Individual
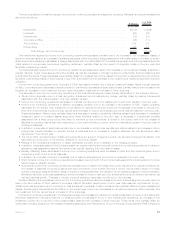
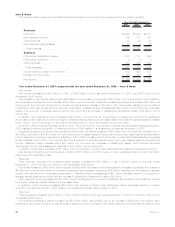
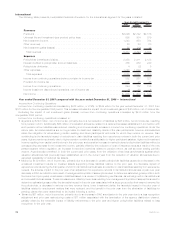
The following table presents consolidated financial information for the Individual segment for the years indicated:
2007 2006 2005
Years Ended December 31,
(In millions)
Revenues
Premiums................................................... $ 4,496 $ 4,516 $ 4,485
Universallifeandinvestment-typeproductpolicyfees...................... 3,513 3,201 2,476
Netinvestmentincome.......................................... 7,052 6,912 6,534
Otherrevenues............................................... 599 527 477
Netinvestmentgains(losses)...................................... (99) (598) (50)
Totalrevenues .............................................. 15,561 14,558 13,922
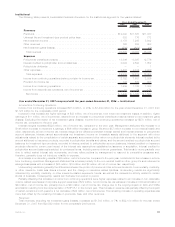
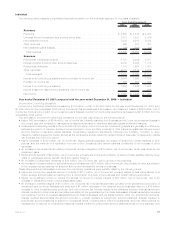
Expenses
Policyholderbenefitsandclaims.................................... 5,721 5,409 5,417
Interestcreditedtopolicyholderaccountbalances ........................ 2,030 2,035 1,775
Policyholderdividends .......................................... 1,718 1,697 1,670
Otherexpenses............................................... 4,031 3,519 3,264
Totalexpenses.............................................. 13,500 12,660 12,126
Incomefromcontinuingoperationsbeforeprovisionforincometax.............. 2,061 1,898 1,796
Provisionforincometax ......................................... 705 652 594
Incomefromcontinuingoperations .................................. 1,356 1,246 1,202
Income(loss)fromdiscontinuedoperations,netofincometax................. 1 18 296
Netincome.................................................. $ 1,357 $ 1,264 $ 1,498
Year ended December 31, 2007 compared with the year ended December 31, 2006 — Individual
Income from Continuing Operations
Income from continuing operations increased by $110 million, or 9%, to $1,356 million for the year ended December 31, 2007 from
$1,246 million for the comparable 2006 period. Included in this increase was a decrease in net investment losses of $324 million, net of
income tax. Excluding the impact of net investment gains (losses), income from continuing operations decreased by $214 million from the
comparable 2006 period.
Thedecreaseinincomefromcontinuingoperationsfortheyearwasdrivenbythefollowingitems:
• Higher DAC amortization of $204 million, net of income tax, primarily resulting from business growth, lower net investment losses in
the current year and revisions to management’s assumptions used to determine estimated gross profits and margins.
• Unfavorable underwriting results in life products of $134 million, net of income tax. Underwriting results are generally the difference
between the portion of premium and fee income intended to cover mortality, morbidity or other insurance costs less claims incurred
and the change in insurance-related liabilities. Underwriting results are significantly influenced by mortality, morbidity, or other
insurance-related experience trends, as well as the reinsurance activity related to certain blocks of business. Consequently, results
can fluctuate from period to period.
• Higher expenses of $129 million, net of income tax. Higher general expenses, the impact of revisions to certain liabilities in both
periods, and the write-off of a receivable from one of the Company’s joint venture partners contributed to the increase in other
expenses.
• An increase in the closed block-related policyholder dividend obligation of $75 million, net of income tax, which was driven by net
investment gains.
• Higher annuity benefits of $24 million, net of income tax, primarily due to higher amortization of deferred costs, partially offset by lower
costs of guaranteed annuity benefit riders and related hedging.
• An increase in policyholder dividends of $14 million, net of income tax, due to growth in the business.
• An increase in interest credited to policyholder account balances of $13 million, net of income tax, due primarily to lower amortization
of the excess interest reserves on acquired annuity and universal life blocks of business.
These aforementioned decreases in income from continuing operations were partially offset by the following items:
• Higher fee income from separate account products of $271 million, net of income tax, primarily related to fees being earned on a
higher average account balance resulting from a combination of growth in the business and overall market performance.
• Higher net investment income on blocks of business not driven by interest margins of $85 million, net of income tax, due to an
increase in yields and growth in the average asset base.
• An increase in interest margins of $18 million, net of income tax. Interest margins relate primarily to the general account portion of
investment-type products. Management attributed a $1 million decrease to the deferred annuity business offset by a $19 million
increase to other investment-type products, both net of income tax. Interest margin is the difference between interest earned and
interest credited to policyholder account balances related to the general account on these businesses. Interest earned approximates
net investment income on invested assets attributed to these businesses with net adjustments for other non-policyholder elements.
Interest credited approximates the amount recorded in interest credited to policyholder account balances. Interest credited to
policyholder account balances is subject to contractual terms, including some minimum guarantees, and may reflect actions by
management to respond to competitive pressures. Interest credited to policyholder account balances tends to move gradually over
27MetLife, Inc.