MetLife 2007 Annual Report Download - page 45
Download and view the complete annual report
Please find page 45 of the 2007 MetLife annual report below. You can navigate through the pages in the report by either clicking on the pages listed below, or by using the keyword search tool below to find specific information within the annual report.-
 1
1 -
2
-
3
-
4
-
5
-
6
-
7
-
8
-
9
-
10
-
11
-
12
-
13
-
14
-
15
-
16
-
17
-
18
-
19
-
20
-
21
-
22
-
23
-
24
-
25
-
26
-
27
-
28
-
29
-
30
-
31
-
32
-
33
-
34
-
 35
35 -
 36
36 -
 37
37 -
 38
38 -
 39
39 -
 40
40 -
 41
41 -
 42
42 -
 43
43 -
 44
44 -
 45
45 -
 46
46 -
 47
47 -
 48
48 -
 49
49 -
 50
50 -
 51
51 -
 52
52 -
 53
53 -
 54
54 -
 55
55 -
56
-
57
-
58
-
59
-
60
-
61
-
62
-
63
-
64
-
65
-
66
-
67
-
68
-
69
-
70
-
71
-
72
-
73
-
74
-
75
-
76
-
77
-
78
-
79
-
80
-
81
-
82
-
83
-
84
-
85
-
86
-
87
-
88
-
89
-
90
-
91
-
92
-
93
-
94
-
95
-
96
-
97
-
98
-
99
-
100
-
101
-
102
-
103
-
104
-
105
-
106
-
107
-
108
-
109
-
110
-
111
-
112
-
113
-
114
-
115
-
116
-
117
-
118
-
119
-
120
-
121
-
122
-
123
-
124
-
125
-
126
-
127
-
128
-
129
-
130
-
131
-
132
-
133
-
134
-
135
-
136
-
137
-
138
-
139
-
140
-
141
-
142
-
143
-
144
-
145
-
146
-
147
-
148
-
149
-
150
-
151
-
152
-
153
-
154
-
155
-
156
-
157
-
158
-
159
-
160
-
161
-
162
-
163
-
164
-
165
-
166
-
167
-
168
-
169
-
170
-
171
-
172
-
173
-
174
-
175
-
176
-
177
-
178
-
179
-
180
-
181
-
182
-
183
-
184
 |
 |

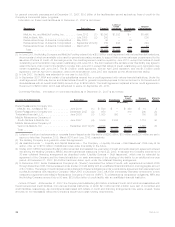
Corporate & Other
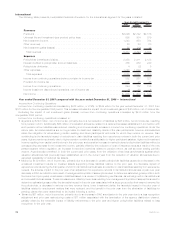
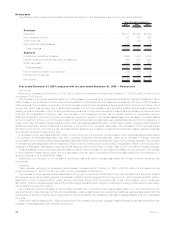
The following table presents consolidated financial information for Corporate & Other for the years indicated:
2007 2006 2005
Years Ended December 31,
(In millions)
Revenues
Premiums ..................................................... $ 35 $ 35 $ 22
Universallifeandinvestment-typeproductpolicyfees......................... — — 1
Netinvestmentincome............................................. 1,460 1,046 699
Otherrevenues.................................................. 63 34 30
Netinvestmentgains(losses) ........................................ 47 (154) (48)
Totalrevenues................................................. 1,605 961 704
Expenses
Policyholderbenefitsandclaims....................................... 47 37 (15)
Otherexpenses ................................................. 1,400 1,349 955
Totalexpenses ................................................ 1,447 1,386 940
Income (loss) from continuing operations before provision (benefit) for income tax. . . . . . . 158 (425) (236)
Incometaxbenefit................................................ (114) (419) (215)
Income(loss)fromcontinuingoperations................................. 272 (6) (21)
Incomefromdiscontinuedoperations,netofincometax....................... 35 3,134 1,167
Netincome.................................................... 307 3,128 1,146
Preferredstockdividends........................................... 137 134 63
Netincomeavailabletocommonshareholders ............................. $ 170 $2,994 $1,083
Year ended December 31, 2007 compared with the year ended December 31, 2006 — Corporate & Other
Income from Continuing Operations
Income from continuing operations increased by $278 million, to a gain of $272 million for the year ended December 31, 2007 from a
loss of $6 million for the comparable 2006 period. Included in this increase were lower net investment losses of $132 million, net of income
tax, resulting in a net investment gain. Excluding the impact of net investment gains (losses), income from continuing operations increased
by $146 million.
The increase in income from continuing operations was primarily attributable to higher net investment income, lower corporate
expenses, higher other revenues, integration costs incurred in the prior year, and lower legal cost of $269 million, $56 million, $19 million,
$17 million, and $7 million, respectively, each of which were net of income tax. This was partially offset by higher interest expense on debt,
higher interest on tax contingencies, and higher interest credited to bankholder deposits of $86 million, $23 million, and $3 million
respectively, each of which were net of income tax. Tax benefits decreased by $103 million over the comparable 2006 period due to the
Company’s implementation of FIN 48, the difference of finalizing the Company’s 2006 tax return in 2007 when compared to finalizing the
Company’s 2005 tax return in 2006 and the difference between the actual and the estimated tax rate allocated to the various segments.
Revenues
Total revenues, excluding net investment gains (losses), increased by $443 million, or 40%, to $1,558 million for the year ended
December 31, 2007 from $1,115 million for the comparable 2006 period. This increase was primarily due to increased net investment
income of $414 million, mainly on fixed maturity securities, driven by a higher asset base related to the reinvestment of proceeds from the
sale of the Peter Cooper Village and Stuyvesant Town properties during the fourth quarter of 2006 and the investment of proceeds from
issuances of junior subordinated debt in December 2006 and December 2007 and collateral financing arrangements to support statutory
reserves in May 2007 and December 2007. Net investment income also increased on other limited partnerships, real estate and real estate
joint ventures, and mortgage loans. Other revenues increased by $29 million primarily related to the resolution of an indemnification claim
associated with the 2000 acquisition of GALIC, offset by an adjustment of surrender values on corporate-owned life insurance policies.
Also included as a component of total revenues was the elimination of intersegment amounts which was offset within total expenses.
Expenses
Total expenses increased by $61 million, or 4%, to $1,447 million for the year ended December 31, 2007 from $1,386 million for the
comparable 2006 period. Interest expense was higher by $133 million due to the issuances of junior subordinated debt in December 2006
and December 2007 and collateral financing arrangements in May 2007 and December 2007, respectively, and from settlement fees on
the prepayment of shares subject to mandatory redemption in October 2007, partially offset by the maturity of senior notes in December
2006 and the reduction of commercial paper outstanding. Interest on tax contingencies was higher by $35 million as a result of an increase
in published Internal Revenue Service (“IRS”) interest rates and a change in the method of estimating interest expense on tax contingencies
associated with the Company’s implementation of FIN 48. As a result of higher interest rates, interest credited on bank deposits increased
by $5 million at MetLife Bank. Corporate expenses are lower by $86 million primarily due to lower corporate support expenses of
$63 million, which included advertising, start-up costs for new products and information technology costs, and lower costs from
reductions of MetLife Foundation contributions of $23 million. Integration costs incurred in 2006 period were $25 million. Legal costs
werelowerby$11millionprimarilyduetoareductioninthecurrentyear of $35 million of legal liabilities resulting from the settlement of
41MetLife, Inc.