MetLife 2007 Annual Report Download - page 122
Download and view the complete annual report
Please find page 122 of the 2007 MetLife annual report below. You can navigate through the pages in the report by either clicking on the pages listed below, or by using the keyword search tool below to find specific information within the annual report.-
 1
1 -
2
-
3
-
4
-
5
-
6
-
7
-
8
-
9
-
10
-
11
-
12
-
13
-
14
-
15
-
16
-
17
-
18
-
19
-
20
-
21
-
22
-
23
-
24
-
25
-
26
-
27
-
28
-
29
-
30
-
31
-
32
-
33
-
34
-
35
-
36
-
37
-
38
-
39
-
40
-
41
-
42
-
43
-
44
-
45
-
46
-
47
-
48
-
49
-
50
-
51
-
52
-
53
-
54
-
55
-
56
-
57
-
58
-
59
-
60
-
61
-
62
-
63
-
64
-
65
-
66
-
67
-
68
-
69
-
70
-
71
-
72
-
73
-
74
-
75
-
76
-
77
-
78
-
79
-
80
-
81
-
82
-
83
-
84
-
85
-
86
-
87
-
88
-
89
-
90
-
91
-
92
-
93
-
94
-
95
-
96
-
97
-
98
-
99
-
100
-
101
-
102
-
103
-
104
-
105
-
106
-
107
-
108
-
109
-
110
-
111
-
 112
112 -
 113
113 -
 114
114 -
 115
115 -
 116
116 -
 117
117 -
 118
118 -
 119
119 -
 120
120 -
 121
121 -
 122
122 -
 123
123 -
 124
124 -
 125
125 -
 126
126 -
 127
127 -
 128
128 -
 129
129 -
 130
130 -
 131
131 -
 132
132 -
133
-
134
-
135
-
136
-
137
-
138
-
139
-
140
-
141
-
142
-
143
-
144
-
145
-
146
-
147
-
148
-
149
-
150
-
151
-
152
-
153
-
154
-
155
-
156
-
157
-
158
-
159
-
160
-
161
-
162
-
163
-
164
-
165
-
166
-
167
-
168
-
169
-
170
-
171
-
172
-
173
-
174
-
175
-
176
-
177
-
178
-
179
-
180
-
181
-
182
-
183
-
184
 |
 |

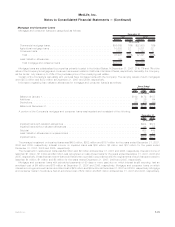
The amortized cost and estimated fair value of fixed maturity securities, by contractual maturity date (excluding scheduled sinking
funds), are as follows:
Amortized
Cost Estimated
Fair Value Amortized
Cost Estimated
Fair Value
2007 2006
December 31,
(In millions)
Dueinoneyearorless.................................... $ 4,537 $ 4,628 $ 6,923 $ 7,011
Due after one year through five years . . . . . . . . . . . . . . . . . . . . . . . . . . 42,453 43,167 45,331 45,928
Due after five years through ten years . . . . . . . . . . . . . . . . . . . . . . . . . . 40,783 41,046 39,571 40,200
Dueaftertenyears ...................................... 65,496 68,143 63,023 66,728
Subtotal . . . . . . . . . . . . . . . . . . . . . . . . . . . . . . . . . . . . . . . . . . . . 153,269 156,984 154,848 159,867
Mortgage-backed and asset-backed securities . . . . . . . . . . . . . . . . . . . . 85,492 85,258 81,920 82,061
Totalfixedmaturitysecurities .............................. $238,761 $242,242 $236,768 $241,928
Fixed maturity securities not due at a single maturity date have been included in the above table in the year of final contractual maturity.
Actual maturities may differ from contractual maturities due to the exercise of prepayment options.
Sales or disposals of fixed maturity and equity securities classified as available-for-sale are as follows:
2007 2006 2005
Years Ended December 31,
(In millions)
Proceeds....................................................... $80,685 $89,869 $127,709
Grossinvestmentgains ............................................. $ 831 $ 580 $ 704
Grossinvestmentlosses............................................. $(1,183) $(1,533) $ (1,391)
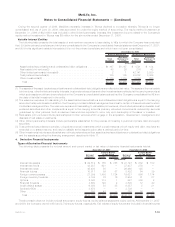
Unrealized Loss for Fixed Maturity and Equity Securities Available-for-Sale
The following tables present the estimated fair value and gross unrealized loss of the Company’s fixed maturity (aggregated by sector)
and equity securities in an unrealized loss position, aggregated by length of time that the securities have been in a continuous unrealized
loss position at:
Estimated
Fair
Value
Gross
Unrealized
Loss
Estimated
Fair
Value
Gross
Unrealized
Loss
Estimated
Fair
Value
Gross
Unrealized
Loss
Less than 12 months Equal to or Greater than
12 months Total
December 31, 2007
(In millions, except number of securities)
U.S.corporatesecurities......................... $29,237 $1,431 $12,119 $ 743 $ 41,356 $2,174
Residential mortgage-backed securities . . . . . . . . . . . . . . . . 14,404 279 6,195 110 20,599 389
Foreign corporate securities . . . . . . . . . . . . . . . . . . . . . . . 11,189 484 6,321 310 17,510 794
U.S.Treasury/agencysecurities..................... 432 3 625 10 1,057 13
Commercial mortgage-backed securities . . . . . . . . . . . . . . . 2,518 102 3,797 97 6,315 199
Foreigngovernmentsecurities...................... 3,593 161 515 27 4,108 188
Asset-backedsecurities.......................... 7,627 442 1,271 107 8,898 549
State and political subdivision securities . . . . . . . . . . . . . . . 1,334 81 476 34 1,810 115
Otherfixedmaturitysecurities...................... 91 30 1 — 92 30
Total fixed maturity securities . . . . . . . . . . . . . . . . . . . . . $70,425 $3,013 $31,320 $1,438 $101,745 $4,451
Equitysecurities............................... $ 2,771 $ 398 $ 543 $ 72 $ 3,314 $ 470
Total number of securities in an unrealized loss position . . . . . 8,395 3,063
F-26 MetLife, Inc.
MetLife, Inc.
Notes to Consolidated Financial Statements — (Continued)