MetLife 2007 Annual Report Download - page 169
Download and view the complete annual report
Please find page 169 of the 2007 MetLife annual report below. You can navigate through the pages in the report by either clicking on the pages listed below, or by using the keyword search tool below to find specific information within the annual report.-
 1
1 -
2
-
3
-
4
-
5
-
6
-
7
-
8
-
9
-
10
-
11
-
12
-
13
-
14
-
15
-
16
-
17
-
18
-
19
-
20
-
21
-
22
-
23
-
24
-
25
-
26
-
27
-
28
-
29
-
30
-
31
-
32
-
33
-
34
-
35
-
36
-
37
-
38
-
39
-
40
-
41
-
42
-
43
-
44
-
45
-
46
-
47
-
48
-
49
-
50
-
51
-
52
-
53
-
54
-
55
-
56
-
57
-
58
-
59
-
60
-
61
-
62
-
63
-
64
-
65
-
66
-
67
-
68
-
69
-
70
-
71
-
72
-
73
-
74
-
75
-
76
-
77
-
78
-
79
-
80
-
81
-
82
-
83
-
84
-
85
-
86
-
87
-
88
-
89
-
90
-
91
-
92
-
93
-
94
-
95
-
96
-
97
-
98
-
99
-
100
-
101
-
102
-
103
-
104
-
105
-
106
-
107
-
108
-
109
-
110
-
111
-
112
-
113
-
114
-
115
-
116
-
117
-
118
-
119
-
120
-
121
-
122
-
123
-
124
-
125
-
126
-
127
-
128
-
129
-
130
-
131
-
132
-
133
-
134
-
135
-
136
-
137
-
138
-
139
-
140
-
141
-
142
-
143
-
144
-
145
-
146
-
147
-
148
-
149
-
150
-
151
-
152
-
153
-
154
-
155
-
156
-
157
-
158
-
 159
159 -
 160
160 -
 161
161 -
 162
162 -
 163
163 -
 164
164 -
 165
165 -
 166
166 -
 167
167 -
 168
168 -
 169
169 -
 170
170 -
 171
171 -
 172
172 -
 173
173 -
 174
174 -
 175
175 -
 176
176 -
 177
177 -
 178
178 -
 179
179 -
180
-
181
-
182
-
183
-
184
 |
 |

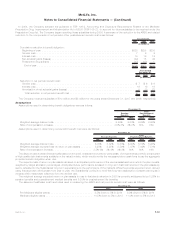
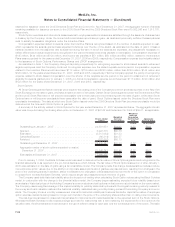
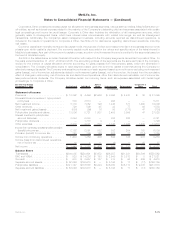
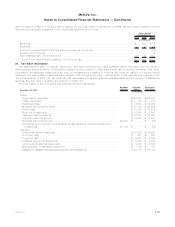
19. Other Expenses
Information on other expenses is as follows:
2007 2006 2005
Years Ended December 31,
(In millions)
Compensation..................................................... $ 3,556 $ 3,426 $3,217
Commissions ..................................................... 4,114 3,801 3,510
Interestanddebtissuecosts........................................... 1,116 900 659
AmortizationofDACandVOBA.......................................... 2,776 2,422 2,450
CapitalizationofDAC ................................................ (3,892) (3,589) (3,604)
Rent,netofsubleaseincome........................................... 309 287 296
Minorityinterest.................................................... 240 234 154
Insurancetax ..................................................... 760 712 530
Other........................................................... 2,694 2,590 2,052
Totalotherexpenses............................................... $11,673 $10,783 $9,264
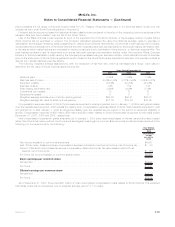
20. Earnings Per Common Share
The following table presents the weighted average shares used in calculating basic earnings per common share and those used in
calculating diluted earnings per common share for each income category presented below:
2007 2006 2005
Years Ended December 31,
(In millions, except share and per share data)
Weighted average common stock outstanding for basic earnings per
common share . . . . . . . . . . . . . . . . . . . . . . . . . . . . . . . . . . . . . . . 744,153,514 761,105,024 749,022,816
Incremental common shares from assumed:
Stock purchase contracts underlying common equity units(1) . . . . . . . . . 7,138,900 1,416,134 —
Exercise or issuance of stock-based awards. . . . . . . . . . . . . . . . . . . . 10,971,585 8,182,938 6,313,540
Weighted average common stock outstanding for diluted earnings per
common share . . . . . . . . . . . . . . . . . . . . . . . . . . . . . . . . . . . . . . . 762,263,999 770,704,096 755,336,356
Earnings per common share before preferred stock dividends:
Income from continuing operations ...................... $ 4,280 $ 3,071 $ 3,071
Basic............................................ $ 5.75 $ 4.03 $ 4.10
Diluted........................................... $ 5.62 $ 3.99 $ 4.06
Income from discontinued operations, net of income tax . . . . . . . $ 37 $ 3,222 $ 1,643
Basic............................................ $ 0.05 $ 4.24 $ 2.19
Diluted........................................... $ 0.04 $ 4.18 $ 2.18
Net income ........................................ $ 4,317 $ 6,293 $ 4,714
Basic............................................ $ 5.80 $ 8.27 $ 6.29
Diluted........................................... $ 5.66 $ 8.17 $ 6.24
Earnings per common share after preferred stock dividends:
Income from continuing operations ...................... $ 4,280 $ 3,071 $ 3,071
Preferredstockdividends................................ 137 134 63
Income from continuing operations available to common
shareholders ..................................... $ 4,143 $ 2,937 $ 3,008
Basic............................................ $ 5.57 $ 3.85 $ 4.02
Diluted........................................... $ 5.44 $ 3.81 $ 3.98
Net income ........................................ $ 4,317 $ 6,293 $ 4,714
Preferredstockdividends................................ 137 134 63
Net income available to common shareholders .................. $ 4,180 $ 6,159 $ 4,651
Basic............................................ $ 5.62 $ 8.09 $ 6.21
Diluted........................................... $ 5.48 $ 7.99 $ 6.16
(1) See Note 13 for a description of the Company’s common equity units.
F-73MetLife, Inc.
MetLife, Inc.
Notes to Consolidated Financial Statements — (Continued)