MetLife 2007 Annual Report Download - page 23
Download and view the complete annual report
Please find page 23 of the 2007 MetLife annual report below. You can navigate through the pages in the report by either clicking on the pages listed below, or by using the keyword search tool below to find specific information within the annual report.-
 1
1 -
2
-
3
-
4
-
5
-
6
-
7
-
8
-
9
-
10
-
11
-
12
-
 13
13 -
 14
14 -
 15
15 -
 16
16 -
 17
17 -
 18
18 -
 19
19 -
 20
20 -
 21
21 -
 22
22 -
 23
23 -
 24
24 -
 25
25 -
 26
26 -
 27
27 -
 28
28 -
 29
29 -
 30
30 -
 31
31 -
 32
32 -
 33
33 -
34
-
35
-
36
-
37
-
38
-
39
-
40
-
41
-
42
-
43
-
44
-
45
-
46
-
47
-
48
-
49
-
50
-
51
-
52
-
53
-
54
-
55
-
56
-
57
-
58
-
59
-
60
-
61
-
62
-
63
-
64
-
65
-
66
-
67
-
68
-
69
-
70
-
71
-
72
-
73
-
74
-
75
-
76
-
77
-
78
-
79
-
80
-
81
-
82
-
83
-
84
-
85
-
86
-
87
-
88
-
89
-
90
-
91
-
92
-
93
-
94
-
95
-
96
-
97
-
98
-
99
-
100
-
101
-
102
-
103
-
104
-
105
-
106
-
107
-
108
-
109
-
110
-
111
-
112
-
113
-
114
-
115
-
116
-
117
-
118
-
119
-
120
-
121
-
122
-
123
-
124
-
125
-
126
-
127
-
128
-
129
-
130
-
131
-
132
-
133
-
134
-
135
-
136
-
137
-
138
-
139
-
140
-
141
-
142
-
143
-
144
-
145
-
146
-
147
-
148
-
149
-
150
-
151
-
152
-
153
-
154
-
155
-
156
-
157
-
158
-
159
-
160
-
161
-
162
-
163
-
164
-
165
-
166
-
167
-
168
-
169
-
170
-
171
-
172
-
173
-
174
-
175
-
176
-
177
-
178
-
179
-
180
-
181
-
182
-
183
-
184
 |
 |

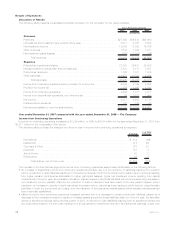
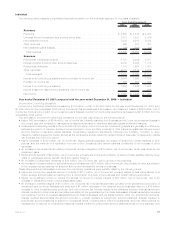
The following table provides the change in income from continuing operations by segment, excluding Travelers, and certain transactions
as mentioned above:
$ Change %ofTotal
$ Change
(In millions)
Institutional . . . . . . . . . . . . . . . . . . . . . . . . . . . . . . . . . . . . . . . . . . . . . . . . . . . . . . . . $(319) (140)%
Individual ......................................................... (68) (30)
International ....................................................... (33) (15)
Corporate&Other ................................................... (25) (11)
Auto&Home....................................................... 192 85
Reinsurance....................................................... 26 11
Total change, net of income tax . . . . . . . . . . . . . . . . . . . . . . . . . . . . . . . . . . . . . . $(227) (100)%
The Institutional segment’s income from continuing operations decreased primarily due to an increase in net investment losses, a
decline in interest margins, an increase in operating expenses, which included a charge associated with costs related to the sale of certain
small market recordkeeping businesses, a charge associated with non-deferrable LTC commissions expense and a charge associated with
costs related to a previously announced regulatory settlement, partially offset by the impact of integration costs in the prior year and
favorable underwriting results.
The Individual segment’s income from continuing operations decreased as a result of an increase in net investment losses, a decline in
interest margins, higher expenses and annuity benefits, as well as increases in interest credited to policyholder account balances and
policyholder dividends. These decreases were partially offset by increased fee income related to the growth in separate account products,
favorable underwriting results in life products, lower DAC amortization and a decrease in the closed block-related policyholder dividend
obligation.
Income from continuing operations in Corporate & Other decreased primarily due to higher investment losses, higher interest expense
on debt, corporate support expenses, interest credited to bankholder deposits and legal-related costs, partially offset by an increase in tax
benefits, an increase in net investment income, lower integration costs and an increase in other revenues.
ThedecreaseinincomefromcontinuingoperationsintheInternational segment was primarily attributable to the following factors:
• Taiwan had a decrease due to a loss recognition adjustment and a restructuring charge, partially offset by reserve refinements
associated with the implementation of a new valuation system.
• Income from continuing operations decreased in Canada primarily due to the realignment of economic capital in the prior year.
• Income from continuing operations in Mexico decreased primarily due to an increase in amortization of DAC, higher operating
expenses, the net impact of an adjustment to the liability for experience refunds on a block of business, a decrease in various one-
time other revenue items in both periods, as well as an increase in income tax expense due to a tax benefit realized in the prior year.
These decreases in Mexico were partially offset by a decrease in certain policyholder liabilities caused by a decrease in unrealized
investment gains on invested assets supporting those liabilities relative to the prior year, a decrease in policyholder benefits
associated with a large group policy that was not renewed by the policyholder, a benefit in the current year from the release of
liabilities for pending claims that were determined to be invalid following a review, and the unfavorable impact in the prior year of
contingent liabilities.
• In addition, a decrease in Brazil was primarily due to an increase in policyholder benefits and claims related to an increase in future
policyholder benefit liabilities on specific blocks of business and an increase in litigation liabilities, as well as adverse claim
experience in the current year.
• The home office recorded higher infrastructure expenditures in support of segment growth, as well as a contingent tax liability. This
was offset by a reduction in the amount charged for economic capital.
• Results of the Company’s investment in Japan decreased primarily due to variability in the hedging program.
• In addition, expenses related to the Company’s start-up operations in Ireland reduced income from continuing operations. A valuation
allowance was established against the deferred tax benefit resulting from the Ireland losses.
• Partially offsetting these decreases in income from continuing operations were increases in Chile and the United Kingdom due to
continued growth of the in-force business.
• In addition, an increase occurred in Australia due to reserve strengthening on a block of business in the prior year.
• South Korea’s income from continuing operations increased due to growth in the in-force business and the implementation of a more
refined reserve valuation system.
• Argentina’s income from continuing operations increased due to higher net investment income resulting from capital contributions,
the release of liabilities for pending claims that were determined to be invalid following a review, the favorable impact of foreign
currency exchange rates and inflation rates on certain contingent liabilities, the utilization of net operating losses for which a valuation
allowance had been previously established, and an increase in the prior year period of a deferred income tax valuation allowance, as
well as business growth. Changes in foreign currency exchange rates also contributed to the increase.
Partially offsetting the decreases in income from continuing operations was an increase in the Auto & Home segment primarily due to a
loss in the third quarter of 2005 related to Hurricane Katrina, favorable development of prior year loss reserves, improvement in non-
catastrophe loss experience and a reduction in loss adjustment expenses. These increases were partially offset by higher catastrophe
losses, excluding Hurricanes Katrina and Wilma, in the current year period, and decreases in net earned premiums, other revenues, and
net investment income, as well as an increase in other expenses.
Income from continuing operations in the Reinsurance segment increased primarily due to added business in-force from facultative and
automatic treaties and renewal premiums on existing blocks of business in the U.S. and international operations, an increase in net
investmentincomeduetogrowthintheinvestedassetbaseandanincrease in other revenues. These items were partially offset by
unfavorable mortality experience, an increase in liabilities associated with Reinsurance Group of America, Incorporated’s (“RGA”) Argentine
19MetLife, Inc.