MetLife 2007 Annual Report Download - page 84
Download and view the complete annual report
Please find page 84 of the 2007 MetLife annual report below. You can navigate through the pages in the report by either clicking on the pages listed below, or by using the keyword search tool below to find specific information within the annual report.-
 1
1 -
2
-
3
-
4
-
5
-
6
-
7
-
8
-
9
-
10
-
11
-
12
-
13
-
14
-
15
-
16
-
17
-
18
-
19
-
20
-
21
-
22
-
23
-
24
-
25
-
26
-
27
-
28
-
29
-
30
-
31
-
32
-
33
-
34
-
35
-
36
-
37
-
38
-
39
-
40
-
41
-
42
-
43
-
44
-
45
-
46
-
47
-
48
-
49
-
50
-
51
-
52
-
53
-
54
-
55
-
56
-
57
-
58
-
59
-
60
-
61
-
62
-
63
-
64
-
65
-
66
-
67
-
68
-
69
-
70
-
71
-
72
-
73
-
 74
74 -
 75
75 -
 76
76 -
 77
77 -
 78
78 -
 79
79 -
 80
80 -
 81
81 -
 82
82 -
 83
83 -
 84
84 -
 85
85 -
 86
86 -
 87
87 -
 88
88 -
 89
89 -
 90
90 -
 91
91 -
 92
92 -
 93
93 -
 94
94 -
95
-
96
-
97
-
98
-
99
-
100
-
101
-
102
-
103
-
104
-
105
-
106
-
107
-
108
-
109
-
110
-
111
-
112
-
113
-
114
-
115
-
116
-
117
-
118
-
119
-
120
-
121
-
122
-
123
-
124
-
125
-
126
-
127
-
128
-
129
-
130
-
131
-
132
-
133
-
134
-
135
-
136
-
137
-
138
-
139
-
140
-
141
-
142
-
143
-
144
-
145
-
146
-
147
-
148
-
149
-
150
-
151
-
152
-
153
-
154
-
155
-
156
-
157
-
158
-
159
-
160
-
161
-
162
-
163
-
164
-
165
-
166
-
167
-
168
-
169
-
170
-
171
-
172
-
173
-
174
-
175
-
176
-
177
-
178
-
179
-
180
-
181
-
182
-
183
-
184
 |
 |

Carrying
Value %of
Tot al Carrying
Value %of
Tot al
December 31, 2007 December 31, 2006
(In millions)
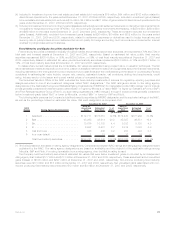
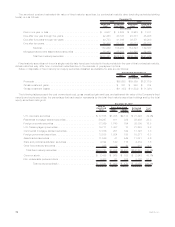
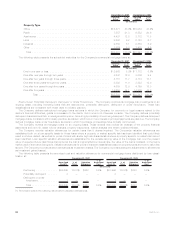
Property Type
Office................................................. $15,471 43.6% $15,083 47.4%
Retail ................................................. 7,557 21.3 6,552 20.6
Apartments ............................................. 4,437 12.5 3,772 11.8
Hotel ................................................. 3,282 9.2 2,120 6.7
Industrial............................................... 2,880 8.1 2,850 8.9
Other ................................................. 1,874 5.3 1,470 4.6
Total . . . . . . . . . . . . . . . . . . . . . . . . . . . . . . . . . . . . . . . . . . . . . . . . $35,501 100.0% $31,847 100.0%
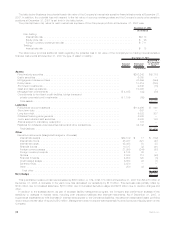
The following table presents the scheduled maturities for the Company’s commercial mortgage loans at:
Carrying
Value %of
Tot al Carrying
Value %of
Tot al
December 31, 2007 December 31, 2006
(In millions)
Dueinoneyearorless...................................... $ 2,963 8.3% $ 1,772 5.6%
Dueafteroneyearthroughtwoyears ............................ 4,247 12.0 3,006 9.4
Dueaftertwoyearsthroughthreeyears........................... 4,151 11.7 4,173 13.1
Dueafterthreeyearsthroughfouryears........................... 3,892 11.0 3,822 12.0
Dueafterfouryearsthroughfiveyears............................ 4,589 12.9 4,769 15.0
Dueafterfiveyears........................................ 15,659 44.1 14,305 44.9
Total . . . . . . . . . . . . . . . . . . . . . . . . . . . . . . . . . . . . . . . . . . . . $35,501 100.0% $31,847 100.0%
Restructured, Potentially Delinquent, Delinquent or Under Foreclosure. The Company monitors its mortgage loan investments on an
ongoing basis, including reviewing loans that are restructured, potentially delinquent, delinquent or under foreclosure. These loan
classifications are consistent with those used in industry practice.
The Company defines restructured mortgage loans as loans in which the Company, for economic or legal reasons related to the
debtor’s financial difficulties, grants a concession to the debtor that it would not otherwise consider. The Company defines potentially
delinquent loans as loans that, in management’s opinion, have a high probability of becoming delinquent. The Company defines delinquent
mortgage loans, consistent with industry practice, as loans in which two or more interest or principal payments are past due. The Company
defines mortgage loans under foreclosure as loans in which foreclosure proceedings have formally commenced.
The Company reviews all mortgage loans on an ongoing basis. These reviews may include an analysis of the property financial
statements and rent roll, lease rollover analysis, property inspections, market analysis and tenant creditworthiness.
The Company records valuation allowances for certain loans that it deems impaired. The Company’s valuation allowances are
established both on a loan specific basis for those loans where a property or market specific risk has been identified that could likely
result in a future default, as well as for pools of loans with similar high risk characteristics where a property specific or market risk has not
been identified. Loan specific valuation allowances are established for the excess carrying value of the mortgage loan over the present
valueofexpectedfuturecashflowsdiscountedattheloan’soriginaleffectiveinterestrate,thevalueoftheloan’scollateral,ortheloan’s
market value if the loan is being sold. Valuation allowances for pools of loans are established based on property types and loan to value risk
factors. The Company records valuation allowances as investment losses. The Company records subsequent adjustments to allowances
as investment gains (losses).
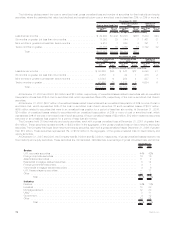
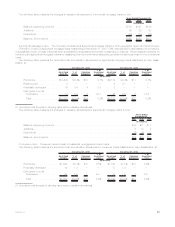
The following table presents the amortized cost and valuation allowance for commercial mortgage loans distributed by loan classi-
fication at:
Amortized
Cost(1) %of
Total Valuation
Allowance
%of
Amortized
Cost Amortized
Cost (1) %of
Tot al Valuation
Allowance
%of
Amortized
Cost
December 31, 2007 December 31, 2006
(In millions)
Performing . . . . . . . . . . . . . $35,665 100.0% $168 0.5% $31,996 100.0% $153 0.5%
Potentially delinquent . . . . . . 3 — — — 3 — — —
Delinquent or under
foreclosure............ 1 — — — 1 — — —
Total . . . . . . . . . . . . . . . . $35,669 100.0% $168 0.5% $32,000 100.0% $153 0.5%
(1) Amortized cost is the carrying value before valuation allowances.
80 MetLife, Inc.