MetLife 2007 Annual Report Download - page 126
Download and view the complete annual report
Please find page 126 of the 2007 MetLife annual report below. You can navigate through the pages in the report by either clicking on the pages listed below, or by using the keyword search tool below to find specific information within the annual report.-
 1
1 -
2
-
3
-
4
-
5
-
6
-
7
-
8
-
9
-
10
-
11
-
12
-
13
-
14
-
15
-
16
-
17
-
18
-
19
-
20
-
21
-
22
-
23
-
24
-
25
-
26
-
27
-
28
-
29
-
30
-
31
-
32
-
33
-
34
-
35
-
36
-
37
-
38
-
39
-
40
-
41
-
42
-
43
-
44
-
45
-
46
-
47
-
48
-
49
-
50
-
51
-
52
-
53
-
54
-
55
-
56
-
57
-
58
-
59
-
60
-
61
-
62
-
63
-
64
-
65
-
66
-
67
-
68
-
69
-
70
-
71
-
72
-
73
-
74
-
75
-
76
-
77
-
78
-
79
-
80
-
81
-
82
-
83
-
84
-
85
-
86
-
87
-
88
-
89
-
90
-
91
-
92
-
93
-
94
-
95
-
96
-
97
-
98
-
99
-
100
-
101
-
102
-
103
-
104
-
105
-
106
-
107
-
108
-
109
-
110
-
111
-
112
-
113
-
114
-
115
-
 116
116 -
 117
117 -
 118
118 -
 119
119 -
 120
120 -
 121
121 -
 122
122 -
 123
123 -
 124
124 -
 125
125 -
 126
126 -
 127
127 -
 128
128 -
 129
129 -
 130
130 -
 131
131 -
 132
132 -
 133
133 -
 134
134 -
 135
135 -
 136
136 -
137
-
138
-
139
-
140
-
141
-
142
-
143
-
144
-
145
-
146
-
147
-
148
-
149
-
150
-
151
-
152
-
153
-
154
-
155
-
156
-
157
-
158
-
159
-
160
-
161
-
162
-
163
-
164
-
165
-
166
-
167
-
168
-
169
-
170
-
171
-
172
-
173
-
174
-
175
-
176
-
177
-
178
-
179
-
180
-
181
-
182
-
183
-
184
 |
 |

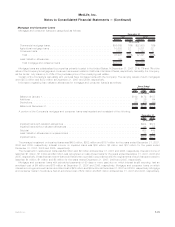
Real Estate Holdings
Real estate holdings consisted of the following:
2007 2006
December 31,
(In millions)
Realestate............................................................... $4,914 $4,326
Accumulateddepreciation..................................................... (1,088) (1,001)
Netrealestate............................................................. 3,826 3,325
Realestatejointventures...................................................... 2,771 1,477
Realestateandrealestatejointventures.......................................... 6,597 4,802
Realestateheld-for-sale...................................................... 172 184
Totalrealestateholdings .................................................... $6,769 $4,986
Related depreciation expense on real estate was $130 million, $131 million and $135 million for the years ended December 31, 2007,
2006 and 2005, respectively. These amounts include $13 million, $37 million and $62 million of depreciation expense related to
discontinued operations for the years ended December 31, 2007, 2006 and 2005, respectively.
There were no impairments recognized on real estate held-for-sale for the year ended December 31, 2007. Impairment losses
recognized on real estate held-for-sale were $8 million and $5 million for the years ended December 31, 2006 and 2005, respectively. The
carrying value of non-income producing real estate was $12 million and $8 million at December 31, 2007 and 2006, respectively. The
Company owned real estate acquired in satisfaction of debt of $3 million at both December 31, 2007 and 2006.
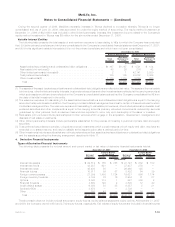
Real estate holdings were categorized as follows:
Amount Percent Amount Percent
2007 2006
December 31,
(In millions)
Office...................................................... $3,126 46% $2,709 55%
Apartments .................................................. 1,264 19 739 15
Developmentjointventures ........................................ 743 11 169 3
Retail ...................................................... 574 8 513 10
Realestateinvestmentfunds....................................... 516 8 401 8
Industrial.................................................... 283 4 291 6
Land....................................................... 174 3 71 1
Agriculture................................................... 29 — 32 1
Other ...................................................... 60 1 61 1
Totalrealestateholdings ........................................ $6,769 100% $4,986 100%
The Company’s real estate holdings are primarily located in the United States. At December 31, 2007, 22%, 11%, 10% and 9% of the
Company’s real estate holdings were located in California, New York, Florida and Texas, respectively.
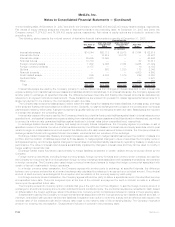
Leveraged Leases
Investment in leveraged leases, included in other invested assets, consisted of the following:
2007 2006
December 31,
(In millions)
Rentalreceivables,net........................................................ $1,491 $1,055
Estimatedresidualvalues...................................................... 1,881 887
Subtotal................................................................ 3,372 1,942
Unearnedincome........................................................... (1,313) (694)
Investmentinleveragedleases................................................. $2,059 $1,248
The Company’s deferred income tax liability related to leveraged leases was $1.0 billion and $670 million at December 31, 2007 and
2006, respectively. The rental receivables set forth above are generally due in periodic installments. The payment periods range from one
to 15 years, but in certain circumstances are as long as 30 years.
The components of net income from investment in leveraged leases are as follows:
2007 2006 2005
Years Ended
December 31,
(In millions)
Income from investment in leveraged leases (included in net investment income) . . . . . . . . . . . . . . . . . $ 67 $ 51 $ 54
Less:Incometaxexpenseonleveragedleases....................................... (24) (18) (19)
Netincomefrominvestmentinleveragedleases...................................... $43 $33 $35
F-30 MetLife, Inc.
MetLife, Inc.
Notes to Consolidated Financial Statements — (Continued)