MetLife 2007 Annual Report Download - page 159
Download and view the complete annual report
Please find page 159 of the 2007 MetLife annual report below. You can navigate through the pages in the report by either clicking on the pages listed below, or by using the keyword search tool below to find specific information within the annual report.-
 1
1 -
2
-
3
-
4
-
5
-
6
-
7
-
8
-
9
-
10
-
11
-
12
-
13
-
14
-
15
-
16
-
17
-
18
-
19
-
20
-
21
-
22
-
23
-
24
-
25
-
26
-
27
-
28
-
29
-
30
-
31
-
32
-
33
-
34
-
35
-
36
-
37
-
38
-
39
-
40
-
41
-
42
-
43
-
44
-
45
-
46
-
47
-
48
-
49
-
50
-
51
-
52
-
53
-
54
-
55
-
56
-
57
-
58
-
59
-
60
-
61
-
62
-
63
-
64
-
65
-
66
-
67
-
68
-
69
-
70
-
71
-
72
-
73
-
74
-
75
-
76
-
77
-
78
-
79
-
80
-
81
-
82
-
83
-
84
-
85
-
86
-
87
-
88
-
89
-
90
-
91
-
92
-
93
-
94
-
95
-
96
-
97
-
98
-
99
-
100
-
101
-
102
-
103
-
104
-
105
-
106
-
107
-
108
-
109
-
110
-
111
-
112
-
113
-
114
-
115
-
116
-
117
-
118
-
119
-
120
-
121
-
122
-
123
-
124
-
125
-
126
-
127
-
128
-
129
-
130
-
131
-
132
-
133
-
134
-
135
-
136
-
137
-
138
-
139
-
140
-
141
-
142
-
143
-
144
-
145
-
146
-
147
-
148
-
 149
149 -
 150
150 -
 151
151 -
 152
152 -
 153
153 -
 154
154 -
 155
155 -
 156
156 -
 157
157 -
 158
158 -
 159
159 -
 160
160 -
 161
161 -
 162
162 -
 163
163 -
 164
164 -
 165
165 -
 166
166 -
 167
167 -
 168
168 -
 169
169 -
170
-
171
-
172
-
173
-
174
-
175
-
176
-
177
-
178
-
179
-
180
-
181
-
182
-
183
-
184
 |
 |

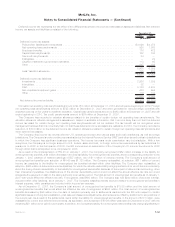
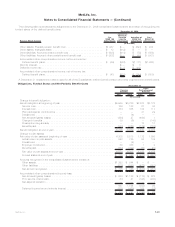
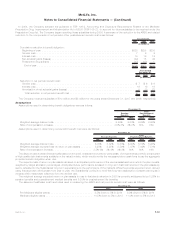
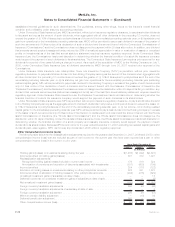
In 2004, the Company adopted the guidance in FSP 106-2, Accounting and Disclosure Requirements Related to the Medicare
Prescription Drug, Improvement and Modernization Act of 2003 (“FSP 106-2”), to account for future subsidies to be received under the
Prescription Drug Act. The Company began receiving these subsidies during 2006. A summary of the reduction to the APBO and related
reduction to the components of net periodic other postretirement benefit cost is as follows:
2007 2006 2005
December 31,
(In millions)
Cumulative reduction in benefit obligation:
Beginningofyear ....................................................... $328 $298 $230
Servicecost........................................................... 7 6 6
Interestcost........................................................... 19 19 16
Netactuarialgains(losses) ................................................. (42) 15 46
Prescriptiondrugsubsidy .................................................. (13) (10) —
Endofyear.......................................................... $299 $328 $298
2007 2006 2005
Years Ended
December 31,
(In millions)
Reduction in net periodic benefit cost:
Servicecost............................................................. $ 7 $ 6 $ 6
Interestcost............................................................. 19 19 16
Amortizationofnetactuarialgains(losses) ......................................... 5 30 23
Totalreductioninnetperiodicbenefitcost........................................ $31 $55 $45
The Company received subsidies of $10 million and $8 million for the years ended December 31, 2007 and 2006, respectively.
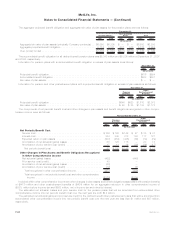
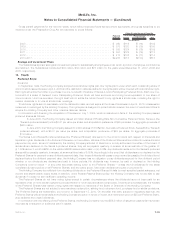
Assumptions
Assumptions used in determining benefit obligations were as follows:
2007 2006 2007 2006
Pension
Benefits
Other
Postretirement
Benefits
December 31,
Weightedaveragediscountrate .................................... 6.65% 6.00% 6.65% 6.00%
Rateofcompensationincrease..................................... 3.5%-8% 3%-8% N/A N/A
Assumptions used in determining net periodic benefit cost were as follows:
2007 2006 2005 2007 2006 2005
Pension Benefits Other
Postretirement Benefits
December 31,
Weighted average discount rate . . . . . . . . . . . . . . . . . . . . . . . 6.00% 5.82% 5.83% 6.00% 5.82% 5.98%
Weighted average expected rate of return on plan assets . . . . . . . 8.25% 8.25% 8.50% 7.47% 7.42% 7.51%
Rateofcompensationincrease........................ 3.5%-8% 3%-8% 3%-8% N/A N/A N/A
The discount rate is determined annually based on the yield, measured on a yield to worst basis, of a hypothetical portfolio constructed
of high quality debt instruments available on the valuation date, which would provide the necessary future cash flows to pay the aggregate
projected benefit obligation when due.
Theexpectedrateofreturnonplanassetsisbasedonanticipatedperformanceofthevariousassetsectorsinwhichtheplaninvests,
weighted by target allocation percentages. Anticipated future performance is based on long-term historical returns of the plan assets by
sector, adjusted for the Subsidiaries’ long-term expectations on the performance of the markets. While the precise expected return derived
using this approach will fluctuate from year to year, the Subsidiaries’ policy is to hold this long-term assumption constant as long as it
remains within reasonable tolerance from the derived rate.
The weighted average expected return on plan assets for use in that plan’s valuation in 2008 is currently anticipated to be 8.25% for
pension benefits and postretirement medical benefits and 6.25% for postretirement life benefits.
The assumed healthcare cost trend rates used in measuring the APBO and net periodic benefit cost were as follows:
2007 2006
December 31,
Pre-Medicareeligibleclaims.......................... 8.5%downto5%in2014 9.0%downto5%in2014
Medicare eligible claims . . . . . . . . . . . . . . . . . . . . . . . . . . . . . 10.5% down to 5% in 2018 11.0% down to 5% in 2018
F-63MetLife, Inc.
MetLife, Inc.
Notes to Consolidated Financial Statements — (Continued)