MetLife 2007 Annual Report Download - page 29
Download and view the complete annual report
Please find page 29 of the 2007 MetLife annual report below. You can navigate through the pages in the report by either clicking on the pages listed below, or by using the keyword search tool below to find specific information within the annual report.-
 1
1 -
2
-
3
-
4
-
5
-
6
-
7
-
8
-
9
-
10
-
11
-
12
-
13
-
14
-
15
-
16
-
17
-
18
-
 19
19 -
 20
20 -
 21
21 -
 22
22 -
 23
23 -
 24
24 -
 25
25 -
 26
26 -
 27
27 -
 28
28 -
 29
29 -
 30
30 -
 31
31 -
 32
32 -
 33
33 -
 34
34 -
 35
35 -
 36
36 -
 37
37 -
 38
38 -
 39
39 -
40
-
41
-
42
-
43
-
44
-
45
-
46
-
47
-
48
-
49
-
50
-
51
-
52
-
53
-
54
-
55
-
56
-
57
-
58
-
59
-
60
-
61
-
62
-
63
-
64
-
65
-
66
-
67
-
68
-
69
-
70
-
71
-
72
-
73
-
74
-
75
-
76
-
77
-
78
-
79
-
80
-
81
-
82
-
83
-
84
-
85
-
86
-
87
-
88
-
89
-
90
-
91
-
92
-
93
-
94
-
95
-
96
-
97
-
98
-
99
-
100
-
101
-
102
-
103
-
104
-
105
-
106
-
107
-
108
-
109
-
110
-
111
-
112
-
113
-
114
-
115
-
116
-
117
-
118
-
119
-
120
-
121
-
122
-
123
-
124
-
125
-
126
-
127
-
128
-
129
-
130
-
131
-
132
-
133
-
134
-
135
-
136
-
137
-
138
-
139
-
140
-
141
-
142
-
143
-
144
-
145
-
146
-
147
-
148
-
149
-
150
-
151
-
152
-
153
-
154
-
155
-
156
-
157
-
158
-
159
-
160
-
161
-
162
-
163
-
164
-
165
-
166
-
167
-
168
-
169
-
170
-
171
-
172
-
173
-
174
-
175
-
176
-
177
-
178
-
179
-
180
-
181
-
182
-
183
-
184
 |
 |
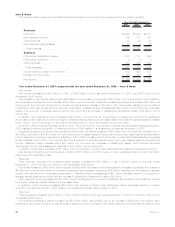
Year ended December 31, 2006 compared with the year ended December 31, 2005 — Institutional
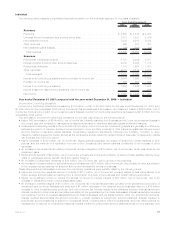
Income from Continuing Operations
Income from continuing operations decreased $263 million, or 19%, to $1,125 million for the year ended December 31, 2006 from
$1,388 million for the comparable 2005 period. The acquisition of Travelers contributed $56 million during the first six months of 2006 to
income from continuing operations, which included a decline of $104 million, net of income tax, of net investment gains (losses). Excluding
the impact of Travelers, income from continuing operations decreased $319 million, or 23%, from the comparable 2005 period.
Included in this decrease was a decline of $300 million, net of income tax, in net investment gains (losses), as well as a decline of
$18 million, net of income tax, resulting from an increase in policyholder benefits and claims related to net investment gains (losses).
Excluding the impact of Travelers and the decline in net investment gains (losses), income from continuing operations was flat when
compared to the prior year period.
A decrease in interest margins of $84 million, net of income tax, compared to the prior year period contributed to the decrease in
income from continuing operations. Management attributes this decrease primarily to the group life and retirement & savings businesses of
$60 million and $51 million, both net of income tax, respectively. Partially offsetting these decreases was an increase of $27 million, net of
income tax, in the non-medical health & other business. Interest margin is the difference between interest earned and interest credited to
policyholder account balances. Interest earned approximates net investment income on investable assets attributed to the segment with
minor adjustments related to the consolidation of certain separate accounts and other minor non-policyholder elements. Interest credited is
the amount attributed to insurance products, recorded in policyholder benefits and claims, and the amount credited to policyholder
account balances for investment-type products, recorded in interest credited to policyholder account balances. Interest credited on
insurance products reflects the current period impact of the interest rate assumptions established at issuance or acquisition. Interest
credited to policyholder account balances is subject to contractual terms, including some minimum guarantees. This tends to move
gradually over time to reflect market interest rate movements, may reflect actions by management to respond to competitive pressures and
therefore, generally does not introduce volatility in expense.
The year over year variance in income from continuing operations included charges recorded in other expenses of $17 million, net of
income tax, associated with costs related to the sale of certain small market recordkeeping businesses, $16 million, net of income tax, due
to costs associated with a previously announced regulatory settlement and $15 million, net of income tax, associated with non-deferrable
LTC commission expense. Partially offsetting these increases in operating expenses were benefits due to prior year charges of $28 million,
net of income tax, as a result of the impact of Travelers’ integration costs and $14 million, net of income tax, related to an adjustment of
DAC for certain LTC products.
Partially offsetting these decreases in income from continuing operations was an increase in underwriting results of $97 million, net of
income tax, compared to the prior year period. This increase was primarily due to favorable results of $48 million, $38 million and
$11 million, all net of income tax, in the group life, the non-medical health & other businesses and the retirement & savings businesses,
respectively.
The results in group life were primarily due to favorable mortality results, predominantly in the term life business, which included a
benefit from reserve refinements in the current year.
Non-medical health & other’s favorable underwriting results were primarily due to improvements in the IDI and dental businesses. The IDI
results included certain reserve refinements in the prior year. Partially offsetting these increases was a decrease in the AD&D and disability
businesses. Disability’s results include the benefit of prior and current year reserve refinements.
Retirement & savings’ underwriting results were favorable with mixed underwriting across several products. Underwriting results are
generally the difference between the portion of premium and fee income intended to cover mortality, morbidity, or other insurance costs
less claims incurred, and the change in insurance-related liabilities. Underwriting results are significantly influenced by mortality, morbidity,
or other insurance-related experience trends and the reinsurance activity related to certain blocks of business.
The remaining increase in operating expenses more than offset the remaining increase in premiums, fees and other revenues.
Revenues
Total revenues, excluding net investment gains (losses), increased by $1,838 million, or 10%, to $20,592 million for the year ended
December 31, 2006 from $18,754 million for the comparable 2005 period. The acquisition of Travelers contributed $797 million during the
first six months of 2006 to the year over year increase. Excluding the impact of the Travelers acquisition, such revenues increased by
$1,041 million, or 6%, from the comparable 2005 period. This increase was comprised of higher net investment income of $583 million and
growth in premiums, fees and other revenues of $458 million.
Net investment income increased by $583 million of which management attributes $463 million to growth in the average asset base
driven by business growth throughout 2005 and 2006, particularly in the GIC and structured settlement businesses and $120 million to an
increase in yields. The increase in yields was primarily attributable to higher yields on fixed maturity securities, an increase in short-term
rates and higher returns on joint ventures. These increases were partially offset by a decline in securities lending results and commercial
mortgage prepayment fees.
The increase of $458 million in premiums, fees and other revenues was largely due to increases in the non-medical health & other
business of $408 million, primarily due to growth in the dental, disability and AD&D products of $255 million. In addition, continued growth
in the LTC and IDI businesses contributed $117 million and $25 million, respectively. Group life increased by $296 million, which
management primarily attributes to the impact of sales and favorable persistency largely in term life business, which includes a significant
increase in premiums from two large customers. Partially offsetting these increases was a decline in retirement & savings’ premiums, fees
and other revenues of $246 million, resulting primarily from a decline of $320 million in structured settlements, predominantly due to the
impact of lower sales. This decline was partially offset by a $83 million increase in MTF premiums. Premiums, fees and other revenues from
retirement & savings products are significantly influenced by large transactions and, as a result, can fluctuate from period to period.
Expenses
Total expenses increased by $1,616 million, or 10%, to $18,274 million for the year ended December 31, 2006 from $16,658 million for
the comparable 2005 period. The acquisition of Travelers contributed $551 million during the first six months of 2006 to the year over year
25MetLife, Inc.