MetLife 2007 Annual Report Download - page 86
Download and view the complete annual report
Please find page 86 of the 2007 MetLife annual report below. You can navigate through the pages in the report by either clicking on the pages listed below, or by using the keyword search tool below to find specific information within the annual report.-
 1
1 -
2
-
3
-
4
-
5
-
6
-
7
-
8
-
9
-
10
-
11
-
12
-
13
-
14
-
15
-
16
-
17
-
18
-
19
-
20
-
21
-
22
-
23
-
24
-
25
-
26
-
27
-
28
-
29
-
30
-
31
-
32
-
33
-
34
-
35
-
36
-
37
-
38
-
39
-
40
-
41
-
42
-
43
-
44
-
45
-
46
-
47
-
48
-
49
-
50
-
51
-
52
-
53
-
54
-
55
-
56
-
57
-
58
-
59
-
60
-
61
-
62
-
63
-
64
-
65
-
66
-
67
-
68
-
69
-
70
-
71
-
72
-
73
-
74
-
75
-
 76
76 -
 77
77 -
 78
78 -
 79
79 -
 80
80 -
 81
81 -
 82
82 -
 83
83 -
 84
84 -
 85
85 -
 86
86 -
 87
87 -
 88
88 -
 89
89 -
 90
90 -
 91
91 -
 92
92 -
 93
93 -
 94
94 -
 95
95 -
 96
96 -
97
-
98
-
99
-
100
-
101
-
102
-
103
-
104
-
105
-
106
-
107
-
108
-
109
-
110
-
111
-
112
-
113
-
114
-
115
-
116
-
117
-
118
-
119
-
120
-
121
-
122
-
123
-
124
-
125
-
126
-
127
-
128
-
129
-
130
-
131
-
132
-
133
-
134
-
135
-
136
-
137
-
138
-
139
-
140
-
141
-
142
-
143
-
144
-
145
-
146
-
147
-
148
-
149
-
150
-
151
-
152
-
153
-
154
-
155
-
156
-
157
-
158
-
159
-
160
-
161
-
162
-
163
-
164
-
165
-
166
-
167
-
168
-
169
-
170
-
171
-
172
-
173
-
174
-
175
-
176
-
177
-
178
-
179
-
180
-
181
-
182
-
183
-
184
 |
 |

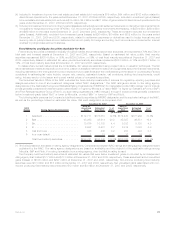
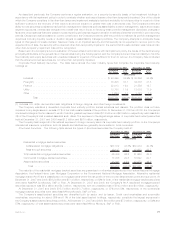
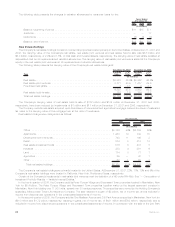
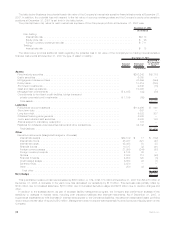
The following table presents the changes in valuation allowances for consumer loans for the:
2007 2006 2005
Years Ended
December 31,
(In millions)
Balance,beginningofperiod............................................... $11 $15 $ 1
Additions............................................................ — — 17
Deductions .......................................................... (5) (4) (3)
Balance,endofperiod................................................... $ 6 $11 $15
Real Estate Holdings
The Company’s real estate holdings consist of commercial properties located primarily in the United States. At December 31, 2007 and
2006, the carrying value of the Company’s real estate, real estate joint ventures and real estate held-for-sale was $6.8 billion and
$5.0 billion, respectively, or 2.0% and 1.5%, of total cash and invested assets, respectively. The carrying value of real estate is stated at
depreciated cost net of impairments and valuation allowances. The carrying value of real estate joint ventures is stated at the Company’s
equity in the real estate joint ventures net of impairments and valuation allowances.
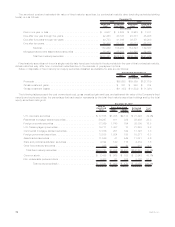
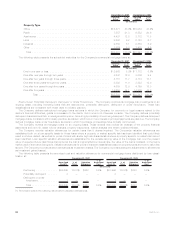
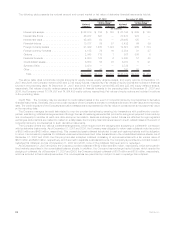
The following table presents the carrying value of the Company’s real estate holdings at:
Type Carrying
Value %of
Tot al Carrying
Value %of
Tot al
December 31, 2007 December 31, 2006
(In millions)
Realestate............................................... $3,823 56.5% $3,322 66.6%
Realestatejointventures ..................................... 2,771 40.9 1,477 29.6
Foreclosedrealestate ....................................... 3 0.1 3 0.1
6,597 97.5 4,802 96.3
Realestateheld-for-sale...................................... 172 2.5 184 3.7
Total real estate holdings . . . . . . . . . . . . . . . . . . . . . . . . . . . . . . . . . . . . . . $6,769 100.0% $4,986 100.0%
The Company’s carrying value of real estate held-for-sale of $172 million and $184 million at December 31, 2007 and 2006,
respectively, have been reduced by impairments of $1 million and $17 million at December 31, 2007 and 2006, respectively.
The Company records real estate acquired upon foreclosure of commercial and agricultural mortgage loans at the lower of estimated
fair value or the carrying value of the mortgage loan at the date of foreclosure.
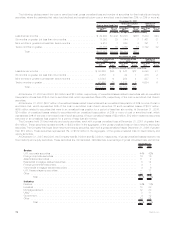
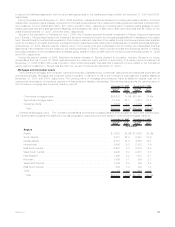
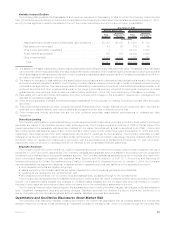
Real estate holdings were categorized as follows:
Amount Percent Amount Percent
2007 2006
December 31,
(In millions)
Office ................................................. $3,126 46% $2,709 55%
Apartments.............................................. 1,264 19 739 15
Developmentjointventures.................................... 743 11 169 3
Retail.................................................. 574 8 513 10
Realestateinvestmentfunds .................................. 516 8 401 8
Industrial ............................................... 283 4 291 6
Land .................................................. 174 3 71 1
Agriculture .............................................. 29 — 32 1
Other.................................................. 60 1 61 1
Totalrealestateholdings.................................... $6,769 100% $4,986 100%
The Company’s real estate holdings are primarily located in the United States. At December 31, 2007, 22%, 11%, 10% and 9% of the
Company’s real estate holdings were located in California, New York, Florida and Texas, respectively.
Certain of the Company’s investments in real estate joint ventures meet the definition of a VIE under FIN 46(r). See “— Composition of
Investment Portfolio Results — Variable Interest Entities.”
In the fourth quarter of 2006, the Company sold its Peter Cooper Village and Stuyvesant Town properties located in Manhattan, New
York for $5.4 billion. The Peter Cooper Village and Stuyvesant Town properties together make up the largest apartment complex in
Manhattan, New York totaling over 11,000 units, spread over 80 contiguous acres. The properties were owned by the Holding Company’s
subsidiary, Metropolitan Tower Life Insurance Company. The sale resulted in a gain of $3 billion, net of income tax, and is included in
income from discontinued operations in the consolidated statements of income.
In the second quarter of 2005, the Company sold its One Madison Avenue and 200 Park Avenue properties in Manhattan, New York for
$918 million and $1.72 billion, respectively, resulting in gains, net of income tax, of $431 million and $762 million, respectively, and is
included in income from discontinued operations in the consolidated statements of income. In connection with the sale of the 200 Park
82 MetLife, Inc.