MetLife 2007 Annual Report Download - page 34
Download and view the complete annual report
Please find page 34 of the 2007 MetLife annual report below. You can navigate through the pages in the report by either clicking on the pages listed below, or by using the keyword search tool below to find specific information within the annual report.-
 1
1 -
2
-
3
-
4
-
5
-
6
-
7
-
8
-
9
-
10
-
11
-
12
-
13
-
14
-
15
-
16
-
17
-
18
-
19
-
20
-
21
-
22
-
23
-
 24
24 -
 25
25 -
 26
26 -
 27
27 -
 28
28 -
 29
29 -
 30
30 -
 31
31 -
 32
32 -
 33
33 -
 34
34 -
 35
35 -
 36
36 -
 37
37 -
 38
38 -
 39
39 -
 40
40 -
 41
41 -
 42
42 -
 43
43 -
 44
44 -
45
-
46
-
47
-
48
-
49
-
50
-
51
-
52
-
53
-
54
-
55
-
56
-
57
-
58
-
59
-
60
-
61
-
62
-
63
-
64
-
65
-
66
-
67
-
68
-
69
-
70
-
71
-
72
-
73
-
74
-
75
-
76
-
77
-
78
-
79
-
80
-
81
-
82
-
83
-
84
-
85
-
86
-
87
-
88
-
89
-
90
-
91
-
92
-
93
-
94
-
95
-
96
-
97
-
98
-
99
-
100
-
101
-
102
-
103
-
104
-
105
-
106
-
107
-
108
-
109
-
110
-
111
-
112
-
113
-
114
-
115
-
116
-
117
-
118
-
119
-
120
-
121
-
122
-
123
-
124
-
125
-
126
-
127
-
128
-
129
-
130
-
131
-
132
-
133
-
134
-
135
-
136
-
137
-
138
-
139
-
140
-
141
-
142
-
143
-
144
-
145
-
146
-
147
-
148
-
149
-
150
-
151
-
152
-
153
-
154
-
155
-
156
-
157
-
158
-
159
-
160
-
161
-
162
-
163
-
164
-
165
-
166
-
167
-
168
-
169
-
170
-
171
-
172
-
173
-
174
-
175
-
176
-
177
-
178
-
179
-
180
-
181
-
182
-
183
-
184
 |
 |

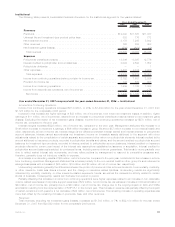
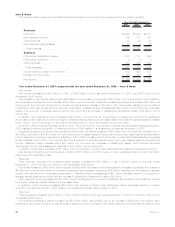
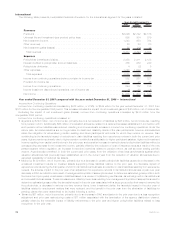
Auto & Home
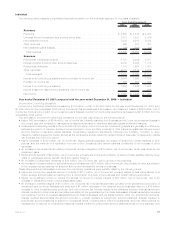
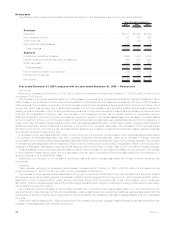
The following table presents consolidated financial information for the Auto & Home segment for the years indicated:
2007 2006 2005
Years Ended December 31,
(In millions)
Revenues
Premiums ..................................................... $2,966 $2,924 $2,911
Netinvestmentincome............................................. 196 177 181
Otherrevenues.................................................. 45 22 33
Netinvestmentgains(losses) ........................................ 16 4 (12)
Totalrevenues................................................. 3,223 3,127 3,113
Expenses
Policyholderbenefitsandclaims....................................... 1,807 1,717 1,994
Policyholderdividends............................................. 4 6 3
Otherexpenses ................................................. 830 845 828
Totalexpenses ................................................ 2,641 2,568 2,825
Incomebeforeprovisionforincometax.................................. 582 559 288
Provisionforincometax............................................ 146 143 64
Netincome.................................................... $ 436 $ 416 $ 224
Year ended December 31, 2007 compared with the year ended December 31, 2006 — Auto & Home
Net Income
Net income increased by $20 million, or 5%, to $436 million for the year ended December 31, 2007 from $416 million for the
comparable 2006 period.
The increase in net income was primarily attributable to an increase in premiums of $28 million, net of income tax. The increase in
premiums was principally due to an increase of $38 million, net of income tax, related to increased exposures, an increase of $4 million, net
of income tax, from various voluntary and involuntary programs and an increase of $4 million, net of income tax, resulting from the change
in estimate on auto rate refunds due to a regulatory examination. Offsetting these increases was a $14 million, net of income tax, decrease
related to a reduction in average earned premium per policy and an increase in catastrophe reinsurance costs of $4 million, net of
income tax.
In addition, net investment income increased by $12 million, net of income tax, due primarily to a realignment of economic capital and
an increase in net investment income from higher yields, somewhat offset by a lower asset base. Net investment gains (losses) increased
by $11 million, net of income tax, for the year ended December 31, 2007 as compared to the prior year.
In addition, other revenues increased by $16 million, net of income tax, due primarily to slower than anticipated claims payments in
2006 resulting in slower recognition of deferred income in 2006 related to a reinsurance contract as compared to 2007.
Negatively impacting net income were additional policyholder benefits and claims of $60 million, net of income tax, primarily due to
$39 million, $20 million, and $16 million, all net of income tax, of losses related to higher claim frequencies, higher earned exposures and
higher losses due to severity, respectively. In addition, a $13 million increase, net of income tax, in unallocated claims adjusting expenses
and an increase of $12 million, net of income tax, from a reduction in favorable development of prior year losses negatively impacted net
income. Offsetting these increases was a $41 million, net of income tax, decrease in catastrophe losses, which included favorable
development of prior year catastrophe reserves of $10 million, net of income tax.
In addition, there was a decrease of $1 million, net of income tax, in policyholder dividends that positively impacted net income.
Also favorably impacting net income was a reduction of $10 million, net of income tax, in other expenses related to lower information
technology and advertising costs.
Revenues
Total revenues, excluding net investment gains (losses), increased by $84 million, or 3%, to $3,207 million for the year ended
December 31, 2007 from $3,123 million for the comparable 2006 period.
Premiums increased by $42 million due principally to a $59 million increase in premiums related to increased exposures, an increase of
$5 million from various voluntary and involuntary programs and an increase in premiums of $5 million, resulting from the change in estimate
on auto rate refunds due to a regulatory examination. Offsetting these increases was a $21 million decrease related to a reduction in
average earned premium per policy and an increase in catastrophe reinsurance costs of $6 million.
Net investment income increased by $19 million due to a realignment of economic capital and an increase in net investment income
from higher yields, somewhat offset by a lower asset base.
In addition, other revenues increased $23 million due primarily to slower than anticipated claims payments resulting in slower
recognition of deferred income in 2006 related to a reinsurance contract as compared to 2007.
Expenses
Total expenses increased by $73 million, or 3%, to $2,641 million for the year ended December 31, 2007 from $2,568 million for the
comparable 2006 period.
Policyholder benefits and claims increased by $90 million which was primarily due to an increase of $59 million from higher claim
frequencies, as a result of a return to normal weather patterns in 2007 compared to the milder weather in 2006 across the majority of the
30 MetLife, Inc.