MetLife 2007 Annual Report Download - page 77
Download and view the complete annual report
Please find page 77 of the 2007 MetLife annual report below. You can navigate through the pages in the report by either clicking on the pages listed below, or by using the keyword search tool below to find specific information within the annual report.-
 1
1 -
2
-
3
-
4
-
5
-
6
-
7
-
8
-
9
-
10
-
11
-
12
-
13
-
14
-
15
-
16
-
17
-
18
-
19
-
20
-
21
-
22
-
23
-
24
-
25
-
26
-
27
-
28
-
29
-
30
-
31
-
32
-
33
-
34
-
35
-
36
-
37
-
38
-
39
-
40
-
41
-
42
-
43
-
44
-
45
-
46
-
47
-
48
-
49
-
50
-
51
-
52
-
53
-
54
-
55
-
56
-
57
-
58
-
59
-
60
-
61
-
62
-
63
-
64
-
65
-
66
-
 67
67 -
 68
68 -
 69
69 -
 70
70 -
 71
71 -
 72
72 -
 73
73 -
 74
74 -
 75
75 -
 76
76 -
 77
77 -
 78
78 -
 79
79 -
 80
80 -
 81
81 -
 82
82 -
 83
83 -
 84
84 -
 85
85 -
 86
86 -
 87
87 -
88
-
89
-
90
-
91
-
92
-
93
-
94
-
95
-
96
-
97
-
98
-
99
-
100
-
101
-
102
-
103
-
104
-
105
-
106
-
107
-
108
-
109
-
110
-
111
-
112
-
113
-
114
-
115
-
116
-
117
-
118
-
119
-
120
-
121
-
122
-
123
-
124
-
125
-
126
-
127
-
128
-
129
-
130
-
131
-
132
-
133
-
134
-
135
-
136
-
137
-
138
-
139
-
140
-
141
-
142
-
143
-
144
-
145
-
146
-
147
-
148
-
149
-
150
-
151
-
152
-
153
-
154
-
155
-
156
-
157
-
158
-
159
-
160
-
161
-
162
-
163
-
164
-
165
-
166
-
167
-
168
-
169
-
170
-
171
-
172
-
173
-
174
-
175
-
176
-
177
-
178
-
179
-
180
-
181
-
182
-
183
-
184
 |
 |

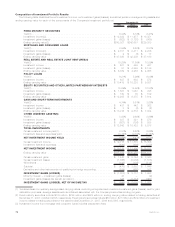
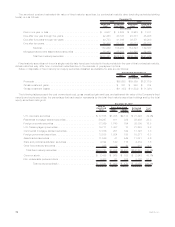
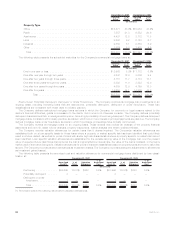
(4) Included in investment income from real estate and real estate joint ventures is $16 million, $94 million and $162 million related to
discontinued operations for the years ended December 31, 2007, 2006 and 2005, respectively. Included in investment gains (losses)
from real estate and real estate joint ventures is $13 million, $4.8 billion and $2.1 billion of gains related to discontinued operations for the
years ended December 31, 2007, 2006 and 2005, respectively.
(5) Included in investment income from other invested assets are scheduled periodic settlement payments on derivative instruments that do
not qualify for hedge accounting under SFAS No. 133, Accounting for Derivative Instruments and Hedging, of $256 million, $290 million
and $99 million for the years ended December 31, 2007, 2006 and 2005, respectively. These amounts are excluded from investment
gains (losses). Additionally, excluded from investment gains (losses) is $26 million, $6 million and ($13) million for the years ended
December 31, 2007, 2006 and 2005, respectively, related to settlement payments on derivatives used to hedge interest rate and
currency risk on policyholders account balances that do not qualify for hedge accounting. Such amounts are included within interest
credited to policyholders account balances.
Fixed Maturity and Equity Securities Available-for-Sale
Fixed maturity securities consisted principally of publicly traded and privately placed debt securities, and represented 70% and 73% of
total cash and invested assets at December 31, 2007 and 2006, respectively. Based on estimated fair value, public fixed maturity
securities represented $205.4 billion, or 85%, and $209.2 billion, or 86%, of total fixed maturity securities at December 31, 2007 and
2006, respectively. Based on estimated fair value, private fixed maturity securities represented $36.8 billion, or 15%, and $32.7 billion, or
14%, of total fixed maturity securities at December 31, 2007 and 2006, respectively.
In cases where quoted market prices are not available, fair values are estimated using present value or valuation techniques. The fair
value estimates are made at a specific point in time, based on available market information and judgments about the financial instruments,
including estimates of the timing and amounts of expected future cash flows and the credit standing of the issuer or counterparty. Factors
considered in estimating fair value include: coupon rate, maturity, estimated duration, call provisions, sinking fund requirements, credit
rating, industry sector of the issuer and quoted market prices of comparable securities.
The Securities Valuation Office of the NAIC evaluates the fixed maturity investments of insurers for regulatory reporting purposes and
assigns securities to one of six investment categories called “NAIC designations.” The NAIC ratings are similar to the rating agency
designations of the Nationally Recognized Statistical Rating Organizations (“NRSROs”) for marketable bonds. NAIC ratings 1 and 2 include
bonds generally considered investment grade (rated “Baa3” or higher by Moody’s, or rated “BBB-” or higher by Standard & Poor’s (“S&P”)
and Fitch Ratings Insurance Group (“Fitch”)), by such rating organizations. NAIC ratings 3 through 6 include bonds generally considered
below investment grade (rated “Ba1” or lower by Moody’s, or rated “BB+” or lower by S&P and Fitch).
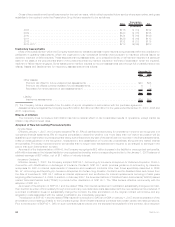
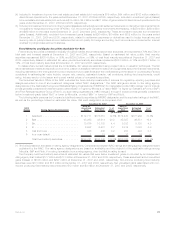
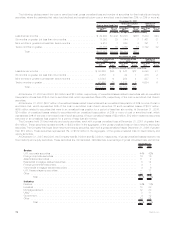
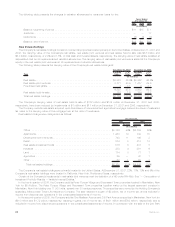
The following table presents the Company’s total fixed maturity securities by NRSRO designation and the equivalent ratings of the NAIC,
as well as the percentage, based on estimated fair value, that each designation is comprised of at:
NAIC
Rating Rating Agency Designation(1)
Cost or
Amortized
Cost Estimated
Fair Value %of
Tot al
Cost or
Amortized
Cost Estimated
Fair Value %of
Tot al
December 31, 2007 December 31, 2006
(In millions)
1 Aaa/Aa/A . . . . . . . . . . . . . . . . . . . . . . $172,711 $175,651 72.5% $174,430 $177,969 73.6%
2 Baa . . . . . . . . . . . . . . . . . . . . . . . . . . 48,265 48,914 20.2 45,897 46,881 19.4
3 Ba........................... 10,676 10,738 4.4 9,332 9,738 4.0
4 B ........................... 6,632 6,481 2.7 6,814 7,030 2.9
5 Caaandlower................... 476 445 0.2 283 294 0.1
6 Inorneardefault ................. 1 13 — 12 16 —
Total fixed maturity securities . . . . . . . . . . $238,761 $242,242 100.0% $236,768 $241,928 100.0%
(1) Amounts presented are based on rating agency designations. Comparisons between NAIC ratings and rating agency designations are
published by the NAIC. The rating agency designations are based on availability and the midpoint of the applicable ratings among
Moody’s, S&P and Fitch. If no rating is available from a rating agency, then the MetLife rating is used.
The Company held fixed maturity securities at estimated fair values that were below investment grade or not rated by an independent
rating agency that totaled $17.7 billion and $17.3 billion at December 31, 2007 and 2006, respectively. These securities had net unrealized
gains (losses) of ($108) million and $627 million at December 31, 2007 and 2006, respectively. Non-income producing fixed maturity
securities were $13 million and $16 million at December 31, 2007 and 2006, respectively. Net unrealized gains associated with non-
income producing fixed maturity securities were $12 million and $4 million at December 31, 2007 and 2006, respectively.
73MetLife, Inc.