MetLife 2007 Annual Report Download - page 76
Download and view the complete annual report
Please find page 76 of the 2007 MetLife annual report below. You can navigate through the pages in the report by either clicking on the pages listed below, or by using the keyword search tool below to find specific information within the annual report.-
 1
1 -
2
-
3
-
4
-
5
-
6
-
7
-
8
-
9
-
10
-
11
-
12
-
13
-
14
-
15
-
16
-
17
-
18
-
19
-
20
-
21
-
22
-
23
-
24
-
25
-
26
-
27
-
28
-
29
-
30
-
31
-
32
-
33
-
34
-
35
-
36
-
37
-
38
-
39
-
40
-
41
-
42
-
43
-
44
-
45
-
46
-
47
-
48
-
49
-
50
-
51
-
52
-
53
-
54
-
55
-
56
-
57
-
58
-
59
-
60
-
61
-
62
-
63
-
64
-
65
-
 66
66 -
 67
67 -
 68
68 -
 69
69 -
 70
70 -
 71
71 -
 72
72 -
 73
73 -
 74
74 -
 75
75 -
 76
76 -
 77
77 -
 78
78 -
 79
79 -
 80
80 -
 81
81 -
 82
82 -
 83
83 -
 84
84 -
 85
85 -
 86
86 -
87
-
88
-
89
-
90
-
91
-
92
-
93
-
94
-
95
-
96
-
97
-
98
-
99
-
100
-
101
-
102
-
103
-
104
-
105
-
106
-
107
-
108
-
109
-
110
-
111
-
112
-
113
-
114
-
115
-
116
-
117
-
118
-
119
-
120
-
121
-
122
-
123
-
124
-
125
-
126
-
127
-
128
-
129
-
130
-
131
-
132
-
133
-
134
-
135
-
136
-
137
-
138
-
139
-
140
-
141
-
142
-
143
-
144
-
145
-
146
-
147
-
148
-
149
-
150
-
151
-
152
-
153
-
154
-
155
-
156
-
157
-
158
-
159
-
160
-
161
-
162
-
163
-
164
-
165
-
166
-
167
-
168
-
169
-
170
-
171
-
172
-
173
-
174
-
175
-
176
-
177
-
178
-
179
-
180
-
181
-
182
-
183
-
184
 |
 |

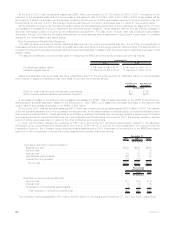
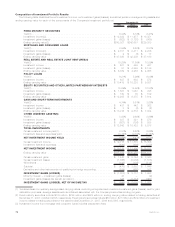
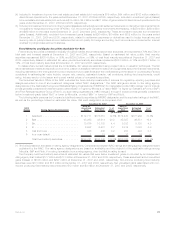
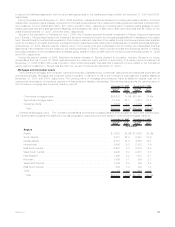
Composition of Investment Portfolio Results
The following table illustrates the net investment income, net investment gains (losses), annualized yields on average ending assets and
ending carrying value for each of the components of the Company’s investment portfolio at:
2007 2006 2005
December 31,
(In millions)
FIXED MATURITY SECURITIES
Yield(1).................................................. 6.34% 6.16% 6.41%
Investmentincome(2)......................................... $ 12,882 $ 11,977 $ 10,351
Investmentgains(losses)...................................... $ (622) $ (1,120) $ (868)
Endingcarryingvalue(2)....................................... $243,021 $242,687 $229,303
MORTGAGE AND CONSUMER LOANS
Yield(1).................................................. 6.55% 6.60% 6.81%
Investmentincome(3)......................................... $ 2,701 $ 2,411 $ 2,236
Investmentgains(losses)...................................... $ 2 $ (8) $ 17
Endingcarryingvalue ........................................ $ 47,030 $ 42,239 $ 37,190
REAL ESTATE AND REAL ESTATE JOINT VENTURES(4)
Yield(1).................................................. 10.28% 11.55% 10.59%
Investmentincome .......................................... $ 607 $ 549 $ 467
Investmentgains(losses)...................................... $ 57 $ 4,898 $ 2,139
Endingcarryingvalue ........................................ $ 6,769 $ 4,986 $ 4,665
POLICY LOANS
Yield(1).................................................. 6.21% 5.99% 6.00%
Investmentincome .......................................... $ 637 $ 603 $ 572
Endingcarryingvalue ........................................ $ 10,419 $ 10,228 $ 9,981
EQUITY SECURITIES AND OTHER LIMITED PARTNERSHIP INTERESTS
Yield(1).................................................. 15.59% 14.90% 12.83%
Investmentincome .......................................... $ 1,567 $ 1,067 $ 798
Investmentgains(losses)...................................... $ 180 $ 85 $ 159
Endingcarryingvalue ........................................ $ 12,205 $ 9,875 $ 7,614
CASH AND SHORT-TERM INVESTMENTS
Yield(1).................................................. 4.74% 5.51% 3.66%
Investmentincome .......................................... $ 437 $ 442 $ 362
Investmentgains(losses)...................................... $ 3 $ (2) $ (2)
Endingcarryingvalue ........................................ $ 13,016 $ 9,816 $ 7,324
OTHER INVESTED ASSETS(5)
Yield(1).................................................. 8.98% 9.60% 8.96%
Investmentincome .......................................... $ 887 $ 821 $ 570
Investmentgains(losses)...................................... $ (627) $ (736) $ 508
Endingcarryingvalue ........................................ $ 12,642 $ 10,428 $ 8,078
TOTAL INVESTMENTS
Grossinvestmentincomeyield(1)................................. 6.81% 6.62% 6.66%
Investmentfeesandexpensesyield............................... (0.15)% (0.15)% (0.15)%
NET INVESTMENT INCOME YIELD ............................. 6.66% 6.47% 6.51%
Grossinvestmentincome...................................... $ 19,718 $ 17,870 $ 15,356
Investmentfeesandexpenses................................... (440) (404) (339)
NET INVESTMENT INCOME .................................. $ 19,278 $ 17,466 $ 15,017
Endingcarryingvalue ........................................ $345,102 $330,259 $304,155
Grossinvestmentgains ....................................... $ 1,440 $ 5,754 $ 3,340
Grossinvestmentlosses ...................................... (1,765) (2,036) (1,578)
Writedowns............................................... (148) (136) (116)
Subtotal................................................. $ (473) $ 3,582 $ 1,646
Derivative and other instruments not qualifying for hedge accounting . . . . . . . . . . (534) (465) 307
INVESTMENT GAINS (LOSSES) ................................ $ (1,007) $ 3,117 $ 1,953
Minorityinterest—investmentgains(losses) ......................... 33 — (9)
Investmentgains(losses)taxbenefit(provision)........................ 326 (1,114) (681)
INVESTMENT GAINS (LOSSES), NET OF INCOME TAX ............... $ (648) $ 2,003 $ 1,263
(1) Yields are based on quarterly average asset carrying values, excluding recognized and unrealized investment gains (losses), and for yield
calculation purposes, average assets exclude collateral associated with the Company’s securities lending program.
(2) Fixed maturity securities include $779 million, $759 million and $825 million in ending carrying value related to trading securities at
December 31, 2007, 2006 and 2005, respectively. Fixed maturity securities include $50 million, $71 million and $14 million of investment
income related to trading securities for the years ended December 31, 2007, 2006 and 2005, respectively.
(3) Investment income from mortgage and consumer loans includes prepayment fees.
72 MetLife, Inc.