MetLife 2007 Annual Report Download - page 79
Download and view the complete annual report
Please find page 79 of the 2007 MetLife annual report below. You can navigate through the pages in the report by either clicking on the pages listed below, or by using the keyword search tool below to find specific information within the annual report.-
 1
1 -
2
-
3
-
4
-
5
-
6
-
7
-
8
-
9
-
10
-
11
-
12
-
13
-
14
-
15
-
16
-
17
-
18
-
19
-
20
-
21
-
22
-
23
-
24
-
25
-
26
-
27
-
28
-
29
-
30
-
31
-
32
-
33
-
34
-
35
-
36
-
37
-
38
-
39
-
40
-
41
-
42
-
43
-
44
-
45
-
46
-
47
-
48
-
49
-
50
-
51
-
52
-
53
-
54
-
55
-
56
-
57
-
58
-
59
-
60
-
61
-
62
-
63
-
64
-
65
-
66
-
67
-
68
-
 69
69 -
 70
70 -
 71
71 -
 72
72 -
 73
73 -
 74
74 -
 75
75 -
 76
76 -
 77
77 -
 78
78 -
 79
79 -
 80
80 -
 81
81 -
 82
82 -
 83
83 -
 84
84 -
 85
85 -
 86
86 -
 87
87 -
 88
88 -
 89
89 -
90
-
91
-
92
-
93
-
94
-
95
-
96
-
97
-
98
-
99
-
100
-
101
-
102
-
103
-
104
-
105
-
106
-
107
-
108
-
109
-
110
-
111
-
112
-
113
-
114
-
115
-
116
-
117
-
118
-
119
-
120
-
121
-
122
-
123
-
124
-
125
-
126
-
127
-
128
-
129
-
130
-
131
-
132
-
133
-
134
-
135
-
136
-
137
-
138
-
139
-
140
-
141
-
142
-
143
-
144
-
145
-
146
-
147
-
148
-
149
-
150
-
151
-
152
-
153
-
154
-
155
-
156
-
157
-
158
-
159
-
160
-
161
-
162
-
163
-
164
-
165
-
166
-
167
-
168
-
169
-
170
-
171
-
172
-
173
-
174
-
175
-
176
-
177
-
178
-
179
-
180
-
181
-
182
-
183
-
184
 |
 |

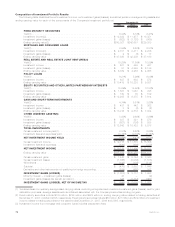
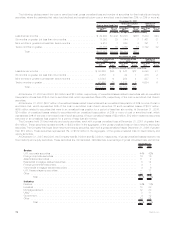
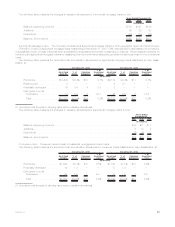
Cost or
Amortized
Cost Gain Loss Estimated
Fair Value %of
Tot al
Gross Unrealized
December 31, 2006
(In millions)
U.S.corporatesecurities ........................... $ 74,010 $2,047 $ 983 $ 75,074 31.0%
Residential mortgage-backed securities . . . . . . . . . . . . . . . . . . 51,602 385 321 51,666 21.4
Foreign corporate securities . . . . . . . . . . . . . . . . . . . . . . . . . 33,029 1,687 378 34,338 14.2
U.S. Treasury/agency securities . . . . . . . . . . . . . . . . . . . . . . . 29,897 984 248 30,633 12.7
Commercial mortgage-backed securities . . . . . . . . . . . . . . . . . 16,467 193 138 16,522 6.8
Foreigngovernmentsecurities........................ 11,406 1,835 34 13,207 5.4
Asset-backedsecurities............................ 13,851 75 53 13,873 5.7
State and political subdivision securities . . . . . . . . . . . . . . . . . 6,121 230 51 6,300 2.6
Otherfixedmaturitysecurities........................ 385 7 77 315 0.2
Total fixed maturity securities . . . . . . . . . . . . . . . . . . . . . . . $236,768 $7,443 $2,283 $241,928 100.0%
Commonstock.................................. $ 1,798 $ 487 $ 16 $ 2,269 44.5%
Non-redeemablepreferredstock ...................... 2,751 103 29 2,825 55.5
Total equity securities(1) . . . . . . . . . . . . . . . . . . . . . . $ 4,549 $ 590 $ 45 $ 5,094 100.0%
(1) Equity securities primarily consist of investments in common and preferred stocks and mutual fund interests. Such securities include
private equity securities with an estimated fair value of $599 million and $238 million at December 31, 2007 and 2006, respectively.
The Company is not exposed to any significant concentrations of credit risk in its equity securities portfolio. The Company is exposed to
concentrations of credit risk related to U.S. Treasury securities and obligations of U.S. government corporations and agencies. Addi-
tionally, at December 31, 2007 and 2006, the Company had exposure to fixed maturity securities backed by sub-prime mortgages with
estimated fair values of $2.2 billion and $3.0 billion, respectively, and unrealized losses of $219 million and $5 million, respectively. These
securities are classified within asset-backed securities in the immediately preceding table. At December 31, 2007, 32% have been
guaranteed by financial guarantors, of which 55% was guaranteed by financial guarantors who remain Aaa rated in 2008. Overall, at
December 31, 2007, $6.7 billion of the estimated fair value of the Company’s fixed maturity securities were credit enhanced by financial
guarantors of which $2.5 billion, $2.5 billion and $1.7 billion at December 31, 2007, are included within state and political subdivisions,
corporate securities and asset-backed securities, respectively, and 80% were guaranteed by financial guarantors who remain Aaa rated in
2008.
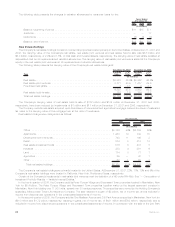
Fixed Maturity and Equity Security Impairment. The Company classifies all of its fixed maturity and equity securities as available-for-
sale and marks them to market through other comprehensive income, except for non-marketable private equities, which are generally
carried at cost and trading securities which are carried at fair value with subsequent changes in fair value recognized in net investment
income. All securities with gross unrealized losses at the consolidated balance sheet date are subjected to the Company’s process for
identifying other-than-temporary impairments. The Company writes down to fair value securities that it deems to be other-than-temporarily
impaired in the period the securities are deemed to be so impaired. The assessment of whether such impairment has occurred is based on
management’s case-by-case evaluation of the underlying reasons for the decline in fair value. Management considers a wide range of
factors, as described in “— Summary of Critical Accounting Estimates — Investments,” about the security issuer and uses its best
judgment in evaluating the cause of the decline in the estimated fair value of the security and in assessing the prospects for near-term
recovery. Inherent in management’s evaluation of the security are assumptions and estimates about the operations of the issuer and its
future earnings potential.
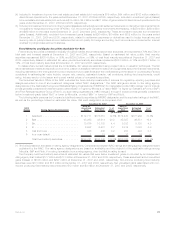
The Company’s review of its fixed maturity and equity securities for impairments includes an analysis of the total gross unrealized losses
by three categories of securities: (i) securities where the estimated fair value had declined and remained below cost or amortized cost by
less than 20%; (ii) securities where the estimated fair value had declined and remained below cost or amortized cost by 20% or more for
less than six months; and (iii) securities where the estimated fair value had declined and remained below cost or amortized cost by 20% or
more for six months or greater. While all of these securities are monitored for potential impairment, the Company’s experience indicates that
the first two categories do not present as great a risk of impairment and, often, fair values recover over time as the factors that caused the
declines improve.
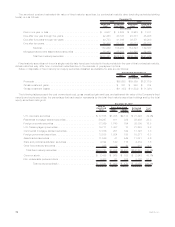
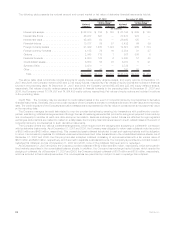
The Company records impairments as investment losses and adjusts the cost basis of the fixed maturity and equity securities
accordingly. The Company does not change the revised cost basis for subsequent recoveries in value. Impairments of fixed maturity and
equity securities were $106 million, $82 million and $64 million for the years ended December 31, 2007, 2006 and 2005, respectively. The
Company’s credit-related impairments of fixed maturity and equity securities were $86 million, $82 million and $64 million for the years
ended December 31, 2007, 2006 and 2005, respectively. The Company’s three largest impairments totaled $19 million, $33 million and
$40 million for the years ended December 31, 2007, 2006 and 2005, respectively. The circumstances that gave rise to these impairments
were financial restructurings, bankruptcy filings or difficult underlying operating environments for the entities concerned. During the years
ended December 31, 2007, 2006 and 2005, the Company sold or disposed of fixed maturity and equity securities at a loss that had a fair
value of $46.8 billion, $70.3 billion and $93.9 billion, respectively. Gross losses excluding impairments for fixed maturity and equity
securities were $1.2 billion, $1.5 billion and $1.4 billion for the years ended December 31, 2007, 2006 and 2005, respectively.
75MetLife, Inc.