MetLife 2007 Annual Report Download - page 134
Download and view the complete annual report
Please find page 134 of the 2007 MetLife annual report below. You can navigate through the pages in the report by either clicking on the pages listed below, or by using the keyword search tool below to find specific information within the annual report.-
 1
1 -
2
-
3
-
4
-
5
-
6
-
7
-
8
-
9
-
10
-
11
-
12
-
13
-
14
-
15
-
16
-
17
-
18
-
19
-
20
-
21
-
22
-
23
-
24
-
25
-
26
-
27
-
28
-
29
-
30
-
31
-
32
-
33
-
34
-
35
-
36
-
37
-
38
-
39
-
40
-
41
-
42
-
43
-
44
-
45
-
46
-
47
-
48
-
49
-
50
-
51
-
52
-
53
-
54
-
55
-
56
-
57
-
58
-
59
-
60
-
61
-
62
-
63
-
64
-
65
-
66
-
67
-
68
-
69
-
70
-
71
-
72
-
73
-
74
-
75
-
76
-
77
-
78
-
79
-
80
-
81
-
82
-
83
-
84
-
85
-
86
-
87
-
88
-
89
-
90
-
91
-
92
-
93
-
94
-
95
-
96
-
97
-
98
-
99
-
100
-
101
-
102
-
103
-
104
-
105
-
106
-
107
-
108
-
109
-
110
-
111
-
112
-
113
-
114
-
115
-
116
-
117
-
118
-
119
-
120
-
121
-
122
-
123
-
 124
124 -
 125
125 -
 126
126 -
 127
127 -
 128
128 -
 129
129 -
 130
130 -
 131
131 -
 132
132 -
 133
133 -
 134
134 -
 135
135 -
 136
136 -
 137
137 -
 138
138 -
 139
139 -
 140
140 -
 141
141 -
 142
142 -
 143
143 -
 144
144 -
145
-
146
-
147
-
148
-
149
-
150
-
151
-
152
-
153
-
154
-
155
-
156
-
157
-
158
-
159
-
160
-
161
-
162
-
163
-
164
-
165
-
166
-
167
-
168
-
169
-
170
-
171
-
172
-
173
-
174
-
175
-
176
-
177
-
178
-
179
-
180
-
181
-
182
-
183
-
184
 |
 |

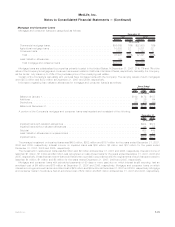
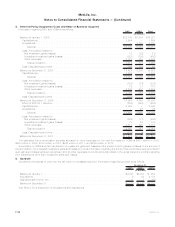
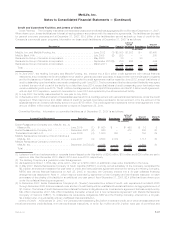
5. Deferred Policy Acquisition Costs and Value of Business Acquired
Information regarding DAC and VOBA is as follows: DAC VOBA Total
(In millions)
Balance at January 1, 2005 . . . . . . . . . . . . . . . . . . . . . . . . . . . . . . . . . . . . . . . . . . . . $12,743 $1,584 $14,327
Capitalizations.................................................... 3,604 — 3,604
Acquisitions ..................................................... — 3,780 3,780
Subtotal..................................................... 16,347 5,364 21,711
Less: Amortization related to:
Netinvestmentgains(losses) ........................................ 12 (25) (13)
Unrealizedinvestmentgains(losses).................................... (323) (139) (462)
Otherexpenses ................................................. 2,128 335 2,463
Totalamortization............................................... 1,817 171 1,988
Less:Dispositionsandother .......................................... 106 (12) 94
Balance at December 31, 2005 . . . . . . . . . . . . . . . . . . . . . . . . . . . . . . . . . . . . . . . . . . 14,424 5,205 19,629
Capitalizations.................................................... 3,589 — 3,589
Subtotal..................................................... 18,013 5,205 23,218
Less: Amortization related to:
Netinvestmentgains(losses) ........................................ (158) (74) (232)
Unrealizedinvestmentgains(losses).................................... 79 31 110
Otherexpenses ................................................. 2,247 407 2,654
Totalamortization............................................... 2,168 364 2,532
Less:Dispositionsandother .......................................... (153) 1 (152)
Balance at December 31, 2006 . . . . . . . . . . . . . . . . . . . . . . . . . . . . . . . . . . . . . . . . . . 15,998 4,840 20,838
EffectofSOP05-1adoption .......................................... (205) (248) (453)
Capitalizations.................................................... 3,892 — 3,892
Acquisitions ..................................................... — 48 48
Subtotal..................................................... 19,685 4,640 24,325
Less: Amortization related to:
Netinvestmentgains(losses) ........................................ (225) (11) (236)
Unrealizedinvestmentgains(losses).................................... 75 63 138
Otherexpenses ................................................. 2,517 495 3,012
Totalamortization............................................... 2,367 547 2,914
Less:Dispositionsandother .......................................... (106) (4) (110)
Balance at December 31, 2007 . . . . . . . . . . . . . . . . . . . . . . . . . . . . . . . . . . . . . . . . . . $17,424 $4,097 $21,521
The estimated future amortization expense allocated to other expenses for the next five years for VOBA is $477 million in 2008,
$423 million in 2009, $379 million in 2010, $342 million in 2011, and $294 million in 2012.
Amortization of VOBA and DAC is related to (i) investment gains and losses and the impact of such gains and losses on the amount of
the amortization; (ii) unrealized investment gains and losses to provide information regarding the amount that would have been amortized if
such gains and losses had been recognized; and (iii) other expenses to provide amounts related to the gross margins or profits originating
from transactions other than investment gains and losses.
6. Goodwill
Goodwill is the excess of cost over the fair value of net assets acquired. Information regarding goodwill is as follows:
2007 2006 2005
December 31,
(In millions)
BalanceatJanuary1,.................................................. $4,897 $4,797 $ 633
Acquisitions ........................................................ 2 93 4,180
Dispositionsandother,net............................................... 11 7 (16)
BalanceatDecember31, ............................................... $4,910 $4,897 $4,797
See Note 2 for a description of acquisitions and dispositions.
F-38 MetLife, Inc.
MetLife, Inc.
Notes to Consolidated Financial Statements — (Continued)