MetLife 2007 Annual Report Download - page 25
Download and view the complete annual report
Please find page 25 of the 2007 MetLife annual report below. You can navigate through the pages in the report by either clicking on the pages listed below, or by using the keyword search tool below to find specific information within the annual report.-
 1
1 -
2
-
3
-
4
-
5
-
6
-
7
-
8
-
9
-
10
-
11
-
12
-
13
-
14
-
 15
15 -
 16
16 -
 17
17 -
 18
18 -
 19
19 -
 20
20 -
 21
21 -
 22
22 -
 23
23 -
 24
24 -
 25
25 -
 26
26 -
 27
27 -
 28
28 -
 29
29 -
 30
30 -
 31
31 -
 32
32 -
 33
33 -
 34
34 -
 35
35 -
36
-
37
-
38
-
39
-
40
-
41
-
42
-
43
-
44
-
45
-
46
-
47
-
48
-
49
-
50
-
51
-
52
-
53
-
54
-
55
-
56
-
57
-
58
-
59
-
60
-
61
-
62
-
63
-
64
-
65
-
66
-
67
-
68
-
69
-
70
-
71
-
72
-
73
-
74
-
75
-
76
-
77
-
78
-
79
-
80
-
81
-
82
-
83
-
84
-
85
-
86
-
87
-
88
-
89
-
90
-
91
-
92
-
93
-
94
-
95
-
96
-
97
-
98
-
99
-
100
-
101
-
102
-
103
-
104
-
105
-
106
-
107
-
108
-
109
-
110
-
111
-
112
-
113
-
114
-
115
-
116
-
117
-
118
-
119
-
120
-
121
-
122
-
123
-
124
-
125
-
126
-
127
-
128
-
129
-
130
-
131
-
132
-
133
-
134
-
135
-
136
-
137
-
138
-
139
-
140
-
141
-
142
-
143
-
144
-
145
-
146
-
147
-
148
-
149
-
150
-
151
-
152
-
153
-
154
-
155
-
156
-
157
-
158
-
159
-
160
-
161
-
162
-
163
-
164
-
165
-
166
-
167
-
168
-
169
-
170
-
171
-
172
-
173
-
174
-
175
-
176
-
177
-
178
-
179
-
180
-
181
-
182
-
183
-
184
 |
 |

Net Investment Gains (Losses)
Net investment losses increased by $1,296 million to a loss of $1,382 million for the year ended December 31, 2006 from a loss of
$86 million for the comparable 2005 period. Excluding the impact of the acquisition of Travelers, which contributed a loss of $294 million
during the first six months of 2006 to the year over year increase, net investment losses increased by $1,002 million. The increase in net
investment losses was due to a combination of losses from the mark-to-market on derivatives and foreign currency transaction losses
during 2006, largely driven by increases in U.S. interest rates and the weakening of the dollar against the major currencies the Company
hedges, notably the euro and pound sterling.
Underwriting
Underwriting results are generally the difference between the portion of premium and fee income intended to cover mortality, morbidity
or other insurance costs, less claims incurred, and the change in insurance-related liabilities. Underwriting results are significantly
influenced by mortality, morbidity or other insurance-related experience trends and the reinsurance activity related to certain blocks of
business and, as a result, can fluctuate from period to period. Underwriting results were favorable within the life products in the Individual
segment, as well as in the Reinsurance segment, and in the group life and non-medical health & other products in the Institutional segment.
Retirement & saving’s underwriting results were mixed across several products in the Institutional segment. Underwriting results, excluding
catastrophes, in the Auto & Home segment were favorable for the year ended December 31, 2006, as the combined ratio, excluding
catastrophes, decreased to 82.8% from 86.7% for the year ended December 31, 2005. Underwriting results in the International segment
increased commensurate with the growth in the business for most countries with the exception of Brazil, which experienced unfavorable
claim experience, and Argentina, which experienced improved claim experience.
Other Expenses
Other expenses increased by $1,519 million, or 16%, to $10,783 million for the year ended December 31, 2006 from $9,264 million for
the comparable 2005 period. Excluding the impact of the acquisition of Travelers, which contributed $605 million during the first six months
of 2006 to the year over year increase, other expenses increased by $914 million. The year ended December 31, 2006 includes a
$35 million contribution to the MetLife Foundation. The year ended December 31, 2005 included a $28 million benefit associated with the
reduction of a previously established real estate transfer tax liability related to MLIC’s demutualization in 2000. Excluding these items and
the acquisition of Travelers, other expenses increased by $851 million from the comparable 2005 period.
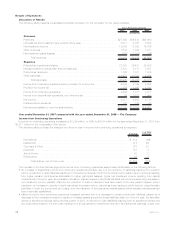
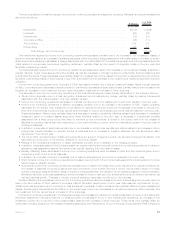
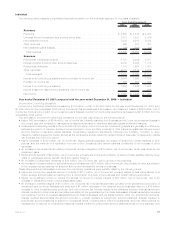
The following table provides the change in other expenses by segment, excluding Travelers, and certain transactions as mentioned
above:
$ Change %ofTotal
$ Change
(In millions)
International ....................................................... $326 38%
Corporate&Other ................................................... 287 34
Reinsurance....................................................... 236 28
Institutional........................................................ 79 9
Auto&Home....................................................... 17 2
Individual ......................................................... (94) (11)
Totalchange................................................... $851 100%
The International segment contributed to the year over year increase in other expenses primarily due to business growth commensurate
with the increase in revenues discussed above and changes in foreign currency exchange rates. This was driven by the following factors:
• Taiwan’s other expenses increased due to an increase in amortization of DAC, due to a loss recognition adjustment, refinements
associated with the implementation of a new valuation system and a restructuring charge.
• Mexico’s other expenses increased due to an increase in commissions commensurate with the revenue growth, higher DAC
amortization, higher expenses related to growth initiatives and additional expenses associated with the Mexican pension business,
partially offset by the unfavorable impact of contingent liabilities that were established in the prior year related to potential employment
matters and which were eliminated in the current year.
• South Korea’s other expenses increased due to an increase in DAC amortization and general expenses, partially offset by a decrease
in DAC amortization associated with the implementation of a more refined reserve valuation system.
• Brazil’s other expenses increased due to an increase in litigation liabilities.
• Other expenses associated with the home office increased due to an increase in expenditures for information technology projects,
growth initiative projects and integration costs, as well as an increase in compensation expense.
• In addition, expenses were incurred related to the start-up of operations in Ireland.
Corporate & Other contributed to the year over year variance in other expenses primarily due to higher interest expense, corporate
support expenses, interest credited to bankholder deposits at MetLife Bank and legal-related costs, partially offset by lower integration
costs.
The Reinsurance segment also contributed to the increase in other expenses primarily due to an increase in expenses associated with
DAC, interest expense and minority interest, as well as an increase in compensation, including equity compensation expense and
overhead-related expenses.
The Institutional segment contributed to the year over year increase primarily due to an increase in non-deferrable volume-related
expenses, a charge associated with costs related to the sale of certain small market recordkeeping businesses, a charge associated with
non-deferrable LTC commissions expense and a charge associated with costs related to a previously announced regulatory settlement, all
within the current year, partially offset by the reduction in Travelers-related integration costs, principally incentive accruals and an
adjustment of DAC for certain LTC products.
21MetLife, Inc.