MetLife 2007 Annual Report Download - page 27
Download and view the complete annual report
Please find page 27 of the 2007 MetLife annual report below. You can navigate through the pages in the report by either clicking on the pages listed below, or by using the keyword search tool below to find specific information within the annual report.-
 1
1 -
2
-
3
-
4
-
5
-
6
-
7
-
8
-
9
-
10
-
11
-
12
-
13
-
14
-
15
-
16
-
 17
17 -
 18
18 -
 19
19 -
 20
20 -
 21
21 -
 22
22 -
 23
23 -
 24
24 -
 25
25 -
 26
26 -
 27
27 -
 28
28 -
 29
29 -
 30
30 -
 31
31 -
 32
32 -
 33
33 -
 34
34 -
 35
35 -
 36
36 -
 37
37 -
38
-
39
-
40
-
41
-
42
-
43
-
44
-
45
-
46
-
47
-
48
-
49
-
50
-
51
-
52
-
53
-
54
-
55
-
56
-
57
-
58
-
59
-
60
-
61
-
62
-
63
-
64
-
65
-
66
-
67
-
68
-
69
-
70
-
71
-
72
-
73
-
74
-
75
-
76
-
77
-
78
-
79
-
80
-
81
-
82
-
83
-
84
-
85
-
86
-
87
-
88
-
89
-
90
-
91
-
92
-
93
-
94
-
95
-
96
-
97
-
98
-
99
-
100
-
101
-
102
-
103
-
104
-
105
-
106
-
107
-
108
-
109
-
110
-
111
-
112
-
113
-
114
-
115
-
116
-
117
-
118
-
119
-
120
-
121
-
122
-
123
-
124
-
125
-
126
-
127
-
128
-
129
-
130
-
131
-
132
-
133
-
134
-
135
-
136
-
137
-
138
-
139
-
140
-
141
-
142
-
143
-
144
-
145
-
146
-
147
-
148
-
149
-
150
-
151
-
152
-
153
-
154
-
155
-
156
-
157
-
158
-
159
-
160
-
161
-
162
-
163
-
164
-
165
-
166
-
167
-
168
-
169
-
170
-
171
-
172
-
173
-
174
-
175
-
176
-
177
-
178
-
179
-
180
-
181
-
182
-
183
-
184
 |
 |

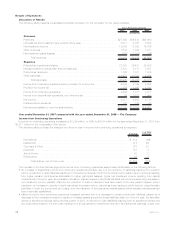
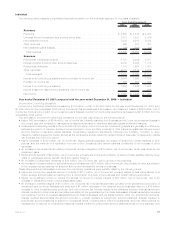
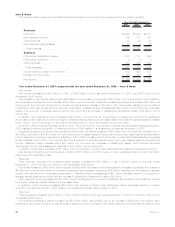
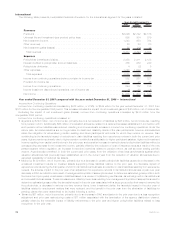
Institutional
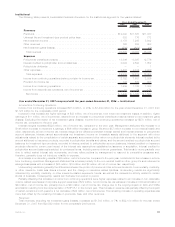
The following table presents consolidated financial information for the Institutional segment for the years indicated:
2007 2006 2005
Years Ended December 31,
(In millions)
Revenues
Premiums................................................... $12,392 $11,867 $11,387
Universallifeandinvestment-typeproductpolicyfees...................... 803 775 772
Netinvestmentincome.......................................... 8,179 7,265 5,942
Otherrevenues............................................... 726 685 653
Netinvestmentgains(losses)...................................... (580) (631) (10)
Totalrevenues .............................................. 21,520 19,961 18,744
Expenses
Policyholderbenefitsandclaims.................................... 13,806 13,367 12,776
Interestcreditedtopolicyholderaccountbalances ........................ 3,094 2,593 1,652
Policyholderdividends .......................................... — — 1
Otherexpenses............................................... 2,438 2,314 2,229
Totalexpenses.............................................. 19,338 18,274 16,658
Incomefromcontinuingoperationsbeforeprovisionforincometax.............. 2,182 1,687 2,086
Provisionforincometax ......................................... 743 562 698
Incomefromcontinuingoperations .................................. 1,439 1,125 1,388
Incomefromdiscontinuedoperations,netofincometax .................... 10 42 174
Netincome ................................................ $ 1,449 $ 1,167 $ 1,562
Year ended December 31, 2007 compared with the year ended December 31, 2006 — Institutional
Income from Continuing Operations
Income from continuing operations increased $314 million, or 28%, to $1,439 million for the year ended December 31, 2007 from
$1,125 million for the comparable 2006 period.
Included in this increase are higher earnings of $33 million, net of income tax, from lower net investment losses. In addition, higher
earnings of $11 million, net of income tax, resulted from an increase in policyholder benefits and claims related to net investment gains
(losses). Excluding the impact of net investment gains (losses), income from continuing operations increased by $270 million, net of
income tax, compared to the prior year.
Interest margins increased $229 million, net of income tax, compared to the prior year. Management attributes this increase to a
$146 million increase in retirement & savings, a $46 million increase in group life and a $37 million increase in non-medical health and
other, respectively, all net of income tax. Interest margin is the difference between interest earned and interest credited to policyholder
account balances. Interest earned approximates net investment income on investable assets attributed to the segment with minor
adjustments related to the consolidation of certain separate accounts and other minor non-policyholder elements. Interest credited is the
amount attributed to insurance products, recorded in policyholder benefits and claims, and the amount credited to policyholder account
balances for investment-type products, recorded in interest credited to policyholder account balances. Interest credited on insurance
products reflects the current year impact of the interest rate assumptions established at issuance or acquisition. Interest credited to
policyholder account balances is subject to contractual terms, including some minimum guarantees. This tends to move gradually over
time to reflect market interest rate movements, and may reflect actions by management to respond to competitive pressures and,
therefore, generally does not introduce volatility in expense.
An increase in underwriting results of $89 million, net of income tax, compared to the prior year, contributed to the increase in income
from continuing operations. Management attributes this increase primarily to the non-medical health & other, group life and retirement &
savings businesses with increases of $65 million, $16 million and $8 million, all net of income tax, respectively.
Underwriting results are generally the difference between the portion of premium and fee income intended to cover mortality, morbidity,
or other insurance costs less claims incurred, and the change in insurance-related liabilities. Underwriting results are significantly
influenced by mortality, morbidity, or other insurance-related experience trends, as well as the reinsurance activity related to certain
blocks of business. Consequently, results can fluctuate from period to period.
Partially offsetting this increase in income from continuing operations were higher expenses related to an increase in non-deferrable
volume-related expenses and corporate support expenses of $72 million, net of income tax, as well as an increase in DAC amortization of
$44 million, net of income tax, primarily due to a $40 million, net of income tax, charge due to the ongoing impact on DAC and VOBA
amortization resulting from the implementation of SOP 05-1 in the current year. This increase in expense was partially offset by the impact
of certain revisions in both years for a net decrease of $34 million, net of income tax. The remaining increase in operating expenses was
more than offset by the remaining increase in premiums, fees, and other revenues.
Revenues
Total revenues, excluding net investment gains (losses), increased by $1,508 million, or 7%, to $22,100 million for the year ended
December 31, 2007 from $20,592 million for the comparable 2006 period.
23MetLife, Inc.