MetLife 2007 Annual Report Download - page 20
Download and view the complete annual report
Please find page 20 of the 2007 MetLife annual report below. You can navigate through the pages in the report by either clicking on the pages listed below, or by using the keyword search tool below to find specific information within the annual report.-
 1
1 -
2
-
3
-
4
-
5
-
6
-
7
-
8
-
9
-
 10
10 -
 11
11 -
 12
12 -
 13
13 -
 14
14 -
 15
15 -
 16
16 -
 17
17 -
 18
18 -
 19
19 -
 20
20 -
 21
21 -
 22
22 -
 23
23 -
 24
24 -
 25
25 -
 26
26 -
 27
27 -
 28
28 -
 29
29 -
 30
30 -
31
-
32
-
33
-
34
-
35
-
36
-
37
-
38
-
39
-
40
-
41
-
42
-
43
-
44
-
45
-
46
-
47
-
48
-
49
-
50
-
51
-
52
-
53
-
54
-
55
-
56
-
57
-
58
-
59
-
60
-
61
-
62
-
63
-
64
-
65
-
66
-
67
-
68
-
69
-
70
-
71
-
72
-
73
-
74
-
75
-
76
-
77
-
78
-
79
-
80
-
81
-
82
-
83
-
84
-
85
-
86
-
87
-
88
-
89
-
90
-
91
-
92
-
93
-
94
-
95
-
96
-
97
-
98
-
99
-
100
-
101
-
102
-
103
-
104
-
105
-
106
-
107
-
108
-
109
-
110
-
111
-
112
-
113
-
114
-
115
-
116
-
117
-
118
-
119
-
120
-
121
-
122
-
123
-
124
-
125
-
126
-
127
-
128
-
129
-
130
-
131
-
132
-
133
-
134
-
135
-
136
-
137
-
138
-
139
-
140
-
141
-
142
-
143
-
144
-
145
-
146
-
147
-
148
-
149
-
150
-
151
-
152
-
153
-
154
-
155
-
156
-
157
-
158
-
159
-
160
-
161
-
162
-
163
-
164
-
165
-
166
-
167
-
168
-
169
-
170
-
171
-
172
-
173
-
174
-
175
-
176
-
177
-
178
-
179
-
180
-
181
-
182
-
183
-
184
 |
 |

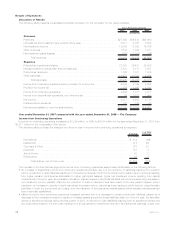
Revenues and Expenses
Premiums, Fees and Other Revenues
Premiums, fees and other revenues increased by $2,185 million, or 7%, to $34,739 million for the year ended December 31, 2007 from
$32,554 million for the comparable 2006 period.
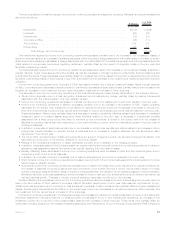
The following table provides the change from the prior year in premiums, fees and other revenues by segment:
$ Change %ofTotal
$ Change
(In millions)
Institutional....................................................... $ 594 27%
Reinsurance...................................................... 573 26
International ...................................................... 560 26
Individual........................................................ 364 17
Auto&Home ..................................................... 65 3
Corporate&Other .................................................. 29 1
Totalchange.................................................. $2,185 100%
The growth in the Institutional segment was primarily due to increases in the non-medical health & other and group life businesses. The
non-medical health & other business increased primarily due to growth in the dental, disability, accidental death & dismemberment
(“AD&D”) and individual disability insurance (“IDI”) businesses. Partially offsetting these increases is a decrease in the long-term care (“LTC”)
business, net of a decrease resulting from a shift to deposit liability-type contracts in the current year, partially offset by growth in the
business. The group life business increased primarily due to business growth in term life and increases in corporate-owned life insurance
and life insurance sold to postretirement benefit plans. These increases in the non-medical health & other and group life businesses were
partially offset by a decrease in the retirement & savings business. The decrease in retirement & savings was primarily due to a decrease in
structured settlement and pension closeout premiums, partially offset by an increase in other products.
The growth in the Reinsurance segment was primarily attributable to premiums from new facultative and automatic treaties and renewal
premiums on existing blocks of business in all RGA’s operating segments. In addition, other revenues increased due to an increase in
surrender charges on asset-intensive business reinsured and an increase in fees associated with financial reinsurance.
ThegrowthintheInternationalsegmentwasprimarilyduetothefollowingfactors:
• An increase in Mexico’s premiums, fees and other revenues due to higher fees and growth in its institutional and universal life
businesses, a decrease in experience refunds during the first quarter of 2007 on Mexico’s institutional business, as well as the
adverse impact in the prior year of an adjustment for experience refunds on Mexico’s institutional business, offset by lower fees
resulting from management’s update of assumptions used to determine estimated gross profits and various one-time revenue items
which benefited both the current and prior years.
• Premiums, fees and other revenues increased in Hong Kong primarily due to the acquisition of the remaining 50% interest in MetLife
Fubon and the resulting consolidation of the operation as well as business growth.
• Chile’s premiums, fees and other revenues increased primarily due to higher annuity sales, higher institutional premiums from its
traditional and bank distribution channels, and the decrease in the prior year resulting from management’s decision not to match
aggressive pricing in the marketplace.
• South Korea’s premiums, fees and other revenues increased primarily due to higher fees from growth in its guaranteed annuity and
variable universal life businesses.
• Brazil’s premiums, fees and other revenues increased due to changes in foreign currency exchange rates and business growth.
• Premiums, fees and other revenues increased in Japan due to an increase in reinsurance assumed.
• Australia’s premiums, fees and other revenues increased primarily due to growth in the institutional and reinsurance business in-
force, an increase in retention levels and changes in foreign currency exchange rates.
• Argentina’s premiums, fees and other revenues increased due to higher pension contributions resulting from higher participant
salaries and a higher salary threshold subject to fees and growth in bancassurance, offset by the reduction of cost of insurance fees
as a result of the new pension system reform regulation.
• Taiwan’s and India’s premiums, fees and other revenues increased primarily due to business growth.
These increases in premiums, fees and other revenues were partially offset by a decrease in the United Kingdom due to an unearned
premium calculation refinement, partially offset by changes in foreign currency exchange rates.
The growth in the Individual segment was primarily due to higher fee income from variable life and annuity and investment-type products
and growth in premiums from other life products, partially offset by a decrease in immediate annuity premiums and a decline in premiums
associated with the Company’s closed block business, in line with expectations.
The growth in the Auto & Home segment was primarily due to an increase in premiums related to increased exposures, an increase in
various voluntary and involuntary programs, and a change in estimate on auto rate refunds due to a regulatory examination, as well as an
increase in other revenues primarily due to slower than anticipated claim payments in 2006. These increases were partially offset by a
reduction in average earned premium per policy, and an increase in catastrophe reinsurance costs.
The increase in Corporate & Other was primarily related to the resolution of an indemnification claim associated with the 2000
acquisition of General American Life Insurance Company (“GALIC”), partially offset by an adjustment of surrender values on corporate-
owned life insurance policies.
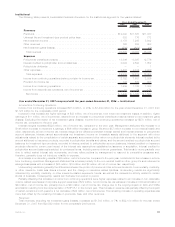
Net Investment Income
Net investment income increased by $1,924 million, or 11%, to $19,006 million for the year ended December 31, 2007 from
$17,082 million for the comparable 2006 period. Management attributes $1,336 million of this increase to growth in the average asset
baseand$588milliontoanincreaseinyields.Theincreaseinnetinvestmentincomefromgrowthintheaverageassetbasewasprimarily
within fixed maturity securities, mortgage loans, real estate joint ventures and other limited partnership interests. The increase in net
16 MetLife, Inc.