MetLife 2007 Annual Report Download - page 85
Download and view the complete annual report
Please find page 85 of the 2007 MetLife annual report below. You can navigate through the pages in the report by either clicking on the pages listed below, or by using the keyword search tool below to find specific information within the annual report.-
 1
1 -
2
-
3
-
4
-
5
-
6
-
7
-
8
-
9
-
10
-
11
-
12
-
13
-
14
-
15
-
16
-
17
-
18
-
19
-
20
-
21
-
22
-
23
-
24
-
25
-
26
-
27
-
28
-
29
-
30
-
31
-
32
-
33
-
34
-
35
-
36
-
37
-
38
-
39
-
40
-
41
-
42
-
43
-
44
-
45
-
46
-
47
-
48
-
49
-
50
-
51
-
52
-
53
-
54
-
55
-
56
-
57
-
58
-
59
-
60
-
61
-
62
-
63
-
64
-
65
-
66
-
67
-
68
-
69
-
70
-
71
-
72
-
73
-
74
-
 75
75 -
 76
76 -
 77
77 -
 78
78 -
 79
79 -
 80
80 -
 81
81 -
 82
82 -
 83
83 -
 84
84 -
 85
85 -
 86
86 -
 87
87 -
 88
88 -
 89
89 -
 90
90 -
 91
91 -
 92
92 -
 93
93 -
 94
94 -
 95
95 -
96
-
97
-
98
-
99
-
100
-
101
-
102
-
103
-
104
-
105
-
106
-
107
-
108
-
109
-
110
-
111
-
112
-
113
-
114
-
115
-
116
-
117
-
118
-
119
-
120
-
121
-
122
-
123
-
124
-
125
-
126
-
127
-
128
-
129
-
130
-
131
-
132
-
133
-
134
-
135
-
136
-
137
-
138
-
139
-
140
-
141
-
142
-
143
-
144
-
145
-
146
-
147
-
148
-
149
-
150
-
151
-
152
-
153
-
154
-
155
-
156
-
157
-
158
-
159
-
160
-
161
-
162
-
163
-
164
-
165
-
166
-
167
-
168
-
169
-
170
-
171
-
172
-
173
-
174
-
175
-
176
-
177
-
178
-
179
-
180
-
181
-
182
-
183
-
184
 |
 |

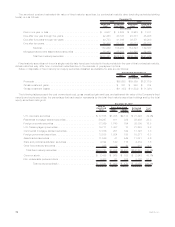
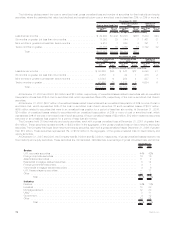
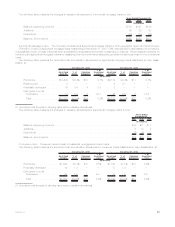
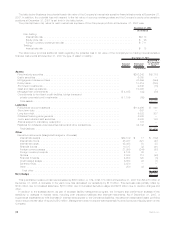
The following table presents the changes in valuation allowances for commercial mortgage loans for the:
2007 2006 2005
Years Ended December 31,
(In millions)
Balance,beginningofperiod ........................................... $153 $147 $149
Additions........................................................ 69 25 43
Deductions....................................................... (54) (19) (45)
Balance,endofperiod ............................................... $168 $153 $147
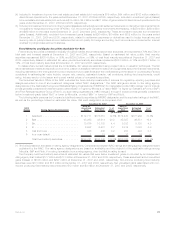
Agricultural Mortgage Loans. The Company diversifies its agricultural mortgage loans by both geographic region and product type.
Of the $10.5 billion of agricultural mortgage loans outstanding at December 31, 2007, 58%, were subject to rate resets prior to maturity.
A substantial portion of these loans has been successfully renegotiated and remain outstanding to maturity. The process and policies for
monitoring the agricultural mortgage loans and classifying them by performance status are generally the same as those for the commercial
loans.
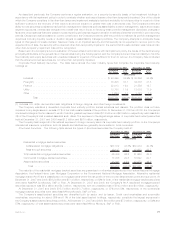
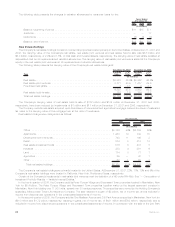
The following table presents the amortized cost and valuation allowances for agricultural mortgage loans distributed by loan classi-
fication at:
Amortized
Cost (1) %of
Total Valuation
Allowance
%of
Amortized
Cost Amortized
Cost(1) %of
Tot al Valuation
Allowance
%of
Amortized
Cost
December 31, 2007 December 31, 2006
(In millions)
Performing . . . . . . . . . . . . . $10,440 99.4% $12 0.1% $9,172 99.4% $11 0.1%
Restructured............ 2 — — — 9 0.1 — —
Potentially delinquent . . . . . . 47 0.4 4 8.5 2 — — —
Delinquent or under
foreclosure............ 19 0.2 8 42.1 48 0.5 7 14.6
Total . . . . . . . . . . . . . . . . $10,508 100.0% $24 0.2% $9,231 100.0% $18 0.2%
(1) Amortized cost is equal to carrying value before valuation allowances.
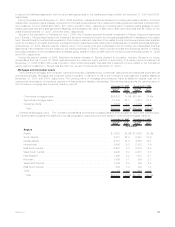
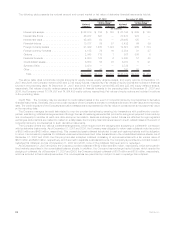
The following table presents the changes in valuation allowances for agricultural mortgage loans for the:
2007 2006 2005
Years Ended
December 31,
(In millions)
Balance,beginningofperiod............................................... $18 $11 $ 7
Additions............................................................ 8 10 4
Deductions .......................................................... (2) (3) —
Balance,endofperiod................................................... $24 $18 $11
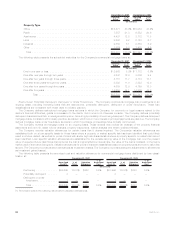
Consumer Loans. Consumer loans consist of residential mortgages and auto loans.
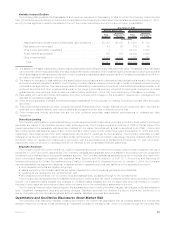
The following table presents the amortized cost and valuation allowances for consumer loans distributed by loan classification at:
Amortized
Cost(1) %of
Total Valuation
Allowance
%of
Amortized
Cost Amortized
Cost(1) %of
Tot al Valuation
Allowance
%of
Amortized
Cost
December 31, 2007 December 31, 2006
(In millions)
Performing . . . . . . . . . . . . . $1,006 95.7% $ 5 0.5% $1,155 97.1% $10 0.9%
Potentially delinquent . . . . . . 19 1.8 — — 17 1.4 — —
Delinquent or under
foreclosure............ 26 2.5 1 4.0 18 1.5 1 5.6
Total . . . . . . . . . . . . . . . . $1,051 100.0% $ 6 0.6% $1,190 100.0% $11 0.9%
(1) Amortized cost is equal to carrying value before valuation allowances.
81MetLife, Inc.