MetLife 2007 Annual Report Download - page 18
Download and view the complete annual report
Please find page 18 of the 2007 MetLife annual report below. You can navigate through the pages in the report by either clicking on the pages listed below, or by using the keyword search tool below to find specific information within the annual report.-
 1
1 -
2
-
3
-
4
-
5
-
6
-
7
-
 8
8 -
 9
9 -
 10
10 -
 11
11 -
 12
12 -
 13
13 -
 14
14 -
 15
15 -
 16
16 -
 17
17 -
 18
18 -
 19
19 -
 20
20 -
 21
21 -
 22
22 -
 23
23 -
 24
24 -
 25
25 -
 26
26 -
 27
27 -
 28
28 -
29
-
30
-
31
-
32
-
33
-
34
-
35
-
36
-
37
-
38
-
39
-
40
-
41
-
42
-
43
-
44
-
45
-
46
-
47
-
48
-
49
-
50
-
51
-
52
-
53
-
54
-
55
-
56
-
57
-
58
-
59
-
60
-
61
-
62
-
63
-
64
-
65
-
66
-
67
-
68
-
69
-
70
-
71
-
72
-
73
-
74
-
75
-
76
-
77
-
78
-
79
-
80
-
81
-
82
-
83
-
84
-
85
-
86
-
87
-
88
-
89
-
90
-
91
-
92
-
93
-
94
-
95
-
96
-
97
-
98
-
99
-
100
-
101
-
102
-
103
-
104
-
105
-
106
-
107
-
108
-
109
-
110
-
111
-
112
-
113
-
114
-
115
-
116
-
117
-
118
-
119
-
120
-
121
-
122
-
123
-
124
-
125
-
126
-
127
-
128
-
129
-
130
-
131
-
132
-
133
-
134
-
135
-
136
-
137
-
138
-
139
-
140
-
141
-
142
-
143
-
144
-
145
-
146
-
147
-
148
-
149
-
150
-
151
-
152
-
153
-
154
-
155
-
156
-
157
-
158
-
159
-
160
-
161
-
162
-
163
-
164
-
165
-
166
-
167
-
168
-
169
-
170
-
171
-
172
-
173
-
174
-
175
-
176
-
177
-
178
-
179
-
180
-
181
-
182
-
183
-
184
 |
 |

Results of Operations
Discussion of Results
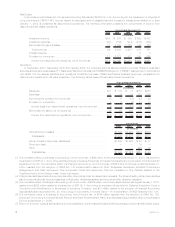
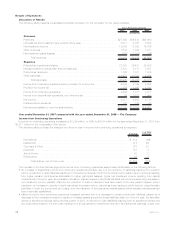
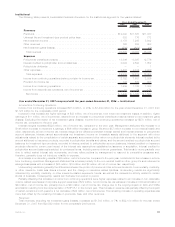
The following table presents consolidated financial information for the Company for the years indicated:
2007 2006 2005
Years Ended December 31,
(In millions)
Revenues
Premiums................................................... $27,895 $26,412 $24,860
Universallifeandinvestment-typeproductpolicyfees...................... 5,311 4,780 3,828
Netinvestmentincome.......................................... 19,006 17,082 14,756
Otherrevenues............................................... 1,533 1,362 1,271
Netinvestmentgains(losses)...................................... (738) (1,382) (86)
Totalrevenues ........................................... 53,007 48,254 44,629
Expenses
Policyholderbenefitsandclaims.................................... 27,828 26,431 25,506
Interestcreditedtopolicyholderaccountbalances ........................ 5,741 5,171 3,887
Policyholderdividends .......................................... 1,726 1,701 1,679
Otherexpenses............................................... 11,673 10,783 9,264
Totalexpenses........................................... 46,968 44,086 40,336
Incomefromcontinuingoperationsbeforeprovisionforincometax.............. 6,039 4,168 4,293
Provisionforincometax ......................................... 1,759 1,097 1,222
Incomefromcontinuingoperations .................................. 4,280 3,071 3,071
Incomefromdiscontinuedoperations,netofincometax .................... 37 3,222 1,643
Netincome.................................................. 4,317 6,293 4,714
Preferredstockdividends ........................................ 137 134 63
Netincomeavailabletocommonshareholders........................... $ 4,180 $ 6,159 $ 4,651
Year ended December 31, 2007 compared with the year ended December 31, 2006 — The Company
Income from Continuing Operations
Income from continuing operations increased by $1,209 million, or 39%, to $4,280 million for the year ended December 31, 2007 from
$3,071 million for the comparable 2006 period.
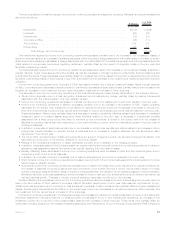
The following table provides the change from the prior year in income from continuing operations by segment:
$ Change %ofTotal
$ Change
(In millions)
International ....................................................... $ 472 39%
Institutional........................................................ 314 26
Corporate&Other ................................................... 278 23
Individual ......................................................... 110 9
Auto&Home....................................................... 20 2
Reinsurance....................................................... 15 1
Totalchange,netofincometax ...................................... $1,209 100%
The increase in the International segment’s income from continuing operations was primarily attributable to the following factors:
• An increase in Argentina’s income from continuing operations primarily due to a net reduction of liabilities resulting from pension
reform, a reduction in claim liabilities resulting from experience reviews in both the current and prior years, higher premiums resulting
from higher pension contributions attributable to higher participant salaries, higher net investment income resulting from capital
contributions in the prior year, and a smaller increase in market indexed policyholder liabilities without a corresponding decrease in
net investment income, partially offset by the reduction of cost of insurance fees as a result of the new pension system reform
regulation, an increase in retention incentives related to pension reform, as well as lower trading portfolio income. Argentina also
benefited, in both the current and prior years, from the utilization of tax loss carryforwards against which valuation allowances had
been previously established.
• Mexico’s income from continuing operations increased primarily due to a decrease in certain policyholder liabilities caused by a
decrease in the unrealized investment results on invested assets supporting those liabilities relative to the prior year, the favorable
impact of experience refunds during the first quarter of 2007, a reduction in claim liabilities resulting from an experience review and
the unfavorable impact in the prior year resulting from an adjustment to experience refunds in its institutional business, a year over
14 MetLife, Inc.