MetLife 2007 Annual Report Download - page 82
Download and view the complete annual report
Please find page 82 of the 2007 MetLife annual report below. You can navigate through the pages in the report by either clicking on the pages listed below, or by using the keyword search tool below to find specific information within the annual report.-
 1
1 -
2
-
3
-
4
-
5
-
6
-
7
-
8
-
9
-
10
-
11
-
12
-
13
-
14
-
15
-
16
-
17
-
18
-
19
-
20
-
21
-
22
-
23
-
24
-
25
-
26
-
27
-
28
-
29
-
30
-
31
-
32
-
33
-
34
-
35
-
36
-
37
-
38
-
39
-
40
-
41
-
42
-
43
-
44
-
45
-
46
-
47
-
48
-
49
-
50
-
51
-
52
-
53
-
54
-
55
-
56
-
57
-
58
-
59
-
60
-
61
-
62
-
63
-
64
-
65
-
66
-
67
-
68
-
69
-
70
-
71
-
 72
72 -
 73
73 -
 74
74 -
 75
75 -
 76
76 -
 77
77 -
 78
78 -
 79
79 -
 80
80 -
 81
81 -
 82
82 -
 83
83 -
 84
84 -
 85
85 -
 86
86 -
 87
87 -
 88
88 -
 89
89 -
 90
90 -
 91
91 -
 92
92 -
93
-
94
-
95
-
96
-
97
-
98
-
99
-
100
-
101
-
102
-
103
-
104
-
105
-
106
-
107
-
108
-
109
-
110
-
111
-
112
-
113
-
114
-
115
-
116
-
117
-
118
-
119
-
120
-
121
-
122
-
123
-
124
-
125
-
126
-
127
-
128
-
129
-
130
-
131
-
132
-
133
-
134
-
135
-
136
-
137
-
138
-
139
-
140
-
141
-
142
-
143
-
144
-
145
-
146
-
147
-
148
-
149
-
150
-
151
-
152
-
153
-
154
-
155
-
156
-
157
-
158
-
159
-
160
-
161
-
162
-
163
-
164
-
165
-
166
-
167
-
168
-
169
-
170
-
171
-
172
-
173
-
174
-
175
-
176
-
177
-
178
-
179
-
180
-
181
-
182
-
183
-
184
 |
 |

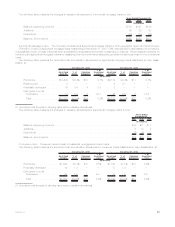
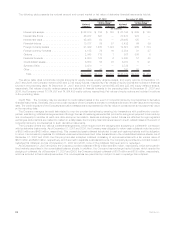
The Company’s asset-backed securities included in the structured securities table above include exposure to sub-prime residential
mortgage-backed securities. Sub-prime mortgage lending is the origination of residential mortgage loans to customers with weak credit
profiles. The Company is not an originator of below-prime mortgages. The Company’s exposure exists through investment in asset-backed
securities which are supported by sub-prime mortgages. The slowing U.S. housing market, greater use of affordable mortgage products,
and relaxed underwriting standards for some originators of below-prime loans have recently led to higher delinquency and loss rates,
especially within the 2006 vintage year. These factors have caused a pull-back in market liquidity and repricing of risk, which has led to an
increase in unrealized losses from December 31, 2006 to December 31, 2007. Based upon the analysis of the Company’s exposure to
sub-prime mortgages through its investment in asset-backed securities, the Company expects to receive payments in accordance with the
contractual terms of the securities.
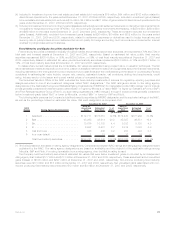
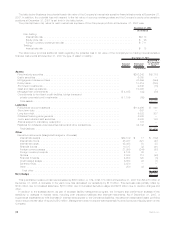
The following table shows the Company’s exposure to asset-backed securities supported by sub-prime mortgage loans by credit
quality:
Cost or
Amortized
Cost Fair
Value
Cost or
Amortized
Cost Fair
Value
Cost or
Amortized
Cost Fair
Value
Cost or
Amortized
Cost Fair
Value
Cost or
Amortized
Cost Fair
Value
Cost or
Amortized
Cost Fair
Value
Aaa Aa A Baa
Below
Investment
Grade Total
December 31, 2007
(In millions)
2003 & Prior . . . . . . . . . . . . . . . . $ 234 $ 223 $132 $125 $19 $17 $14 $13 $ 4 $ 2 $ 403 $ 380
2004 . . . . . . . . . . . . . . . . . . . . . 212 195 446 414 27 24 — — 1 — 686 633
2005 . . . . . . . . . . . . . . . . . . . . . 551 502 278 252 22 18 5 4 — — 856 776
2006 . . . . . . . . . . . . . . . . . . . . . 258 235 69 47 — — — — — — 327 282
2007 . . . . . . . . . . . . . . . . . . . . . 152 142 17 9 — — — — — — 169 151
Total ................... $1,407 $1,297 $942 $847 $68 $59 $19 $17 $5 $2 $2,441 $2,222
Cost or
Amortized
Cost Fair
Value
Cost or
Amortized
Cost Fair
Value
Cost or
Amortized
Cost Fair
Value
Cost or
Amortized
Cost Fair
Value
Cost or
Amortized
Cost Fair
Value
Cost or
Amortized
Cost Fair
Value
Aaa Aa A Baa
Below
Investment
Grade Total
December 31, 2006
(In millions)
2003 & Prior. . . . . . . . . . . . . . . $ 319 $ 317 $ 285 $ 285 $ 60 $ 60 $33 $33 $— $— $ 697 $ 695
2004 . . . . . . . . . . . . . . . . . . . 307 305 456 458 47 47 15 15 — — 825 825
2005 . . . . . . . . . . . . . . . . . . . 736 730 305 306 22 22 — — — — 1,063 1,058
2006 . . . . . . . . . . . . . . . . . . . 321 322 42 43 57 57 32 32 — — 452 454
Total . . . . . . . . . . . . . . . . . . $1,683 $1,674 $1,088 $1,092 $186 $186 $80 $80 $— $— $3,037 $3,032
At December 31, 2007 and 2006, the Company had $2.2 billion and $3.0 billion, respectively, of asset-backed securities supported by
sub-prime mortgage loans as outlined in the tables above. At December 31, 2007, approximately 96% of the portfolio is rated Aaa, Aa or
better of which 80% was in vintage year 2005 and prior. At December 31, 2006, approximately 91% of the portfolio was rated Aaa, Aa or
better of which 87% was in vintage year 2005 and prior. These older vintages benefit from better underwriting, improved enhancement
levels and higher house price appreciation.
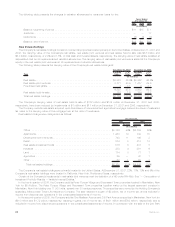
Asset-backed securities also include collateralized debt obligations backed by sub-prime mortgages at an aggregate cost of $64 million
with a fair value of $48 million at December 31, 2007 and an aggregate cost of $93 million with a fair value of $92 million at December 31,
2006, which are not included in the tables above.
Assets on Deposit and Held in Trust and Assets Pledged as Collateral
The Company had investment assets on deposit with regulatory agencies with a fair market value of $1.8 billion and $1.3 billion at
December 31, 2007 and 2006, respectively, consisting primarily of fixed maturity and equity securities. Company securities held in trust to
satisfy collateral requirements had a cost or amortized cost of $7.1 billion and $3.0 billion at December 31, 2007 and 2006, respectively,
consisting primarily of fixed maturity and equity securities.
Certain of the Company’s fixed maturity securities are pledged as collateral for various transactions as described in “ — Composition of
Investment Portfolio Results — Derivative Financial Instruments — Credit Risk.” Additionally, the Company has pledged certain of its fixed
maturity securities in support of its debt and funding agreements as described in “ — Off-Balance Sheet Arrangements — Other
Commitments.”
Trading Securities
The Company has a trading securities portfolio to support investment strategies that involve the active and frequent purchase and sale
of securities, the execution of short sale agreements and asset and liability matching strategies for certain insurance products. Trading
securities and short sale agreement liabilities are recorded at fair value with subsequent changes in fair value recognized in net investment
income related to fixed maturity securities.
At December 31, 2007 and 2006, trading securities were $779 million and $759 million, respectively, and liabilities associated with the
short sale agreements in the trading securities portfolio, which were included in other liabilities, were $107 million and $387 million,
respectively. The Company had pledged $407 million and $614 million of its assets, primarily consisting of trading securities, as collateral
78 MetLife, Inc.