MetLife 2007 Annual Report Download - page 42
Download and view the complete annual report
Please find page 42 of the 2007 MetLife annual report below. You can navigate through the pages in the report by either clicking on the pages listed below, or by using the keyword search tool below to find specific information within the annual report.-
 1
1 -
2
-
3
-
4
-
5
-
6
-
7
-
8
-
9
-
10
-
11
-
12
-
13
-
14
-
15
-
16
-
17
-
18
-
19
-
20
-
21
-
22
-
23
-
24
-
25
-
26
-
27
-
28
-
29
-
30
-
31
-
 32
32 -
 33
33 -
 34
34 -
 35
35 -
 36
36 -
 37
37 -
 38
38 -
 39
39 -
 40
40 -
 41
41 -
 42
42 -
 43
43 -
 44
44 -
 45
45 -
 46
46 -
 47
47 -
 48
48 -
 49
49 -
 50
50 -
 51
51 -
 52
52 -
53
-
54
-
55
-
56
-
57
-
58
-
59
-
60
-
61
-
62
-
63
-
64
-
65
-
66
-
67
-
68
-
69
-
70
-
71
-
72
-
73
-
74
-
75
-
76
-
77
-
78
-
79
-
80
-
81
-
82
-
83
-
84
-
85
-
86
-
87
-
88
-
89
-
90
-
91
-
92
-
93
-
94
-
95
-
96
-
97
-
98
-
99
-
100
-
101
-
102
-
103
-
104
-
105
-
106
-
107
-
108
-
109
-
110
-
111
-
112
-
113
-
114
-
115
-
116
-
117
-
118
-
119
-
120
-
121
-
122
-
123
-
124
-
125
-
126
-
127
-
128
-
129
-
130
-
131
-
132
-
133
-
134
-
135
-
136
-
137
-
138
-
139
-
140
-
141
-
142
-
143
-
144
-
145
-
146
-
147
-
148
-
149
-
150
-
151
-
152
-
153
-
154
-
155
-
156
-
157
-
158
-
159
-
160
-
161
-
162
-
163
-
164
-
165
-
166
-
167
-
168
-
169
-
170
-
171
-
172
-
173
-
174
-
175
-
176
-
177
-
178
-
179
-
180
-
181
-
182
-
183
-
184
 |
 |

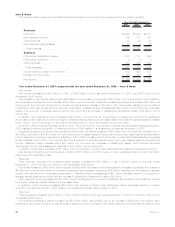
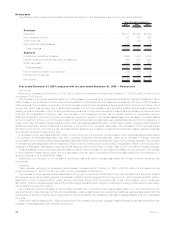
Reinsurance
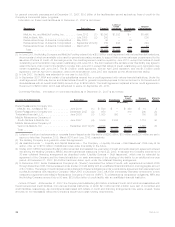
The following table presents consolidated financial information for the Reinsurance segment for the years indicated:
2007 2006 2005
Years Ended December 31,
(In millions)
Revenues
Premiums ..................................................... $4,910 $4,348 $3,869
Netinvestmentincome............................................. 871 732 606
Otherrevenues.................................................. 77 66 58
Netinvestmentgains(losses) ........................................ (177) 7 22
Totalrevenues................................................. 5,681 5,153 4,555
Expenses
Policyholderbenefitsandclaims....................................... 3,989 3,490 3,206
Interestcreditedtopolicyholderaccountbalances........................... 262 254 220
Otherexpenses ................................................. 1,226 1,227 991
Totalexpenses ................................................ 5,477 4,971 4,417
Incomebeforeprovisionforincometax.................................. 204 182 138
Provisionforincometax............................................ 71 64 46
Netincome.................................................... $ 133 $ 118 $ 92
Year ended December 31, 2007 compared with the year ended December 31, 2006 — Reinsurance
Net Income
Net income increased by $15 million, or 13%, to $133 million for the twelve months ended December 31, 2007 from $118 million for the
comparable 2006 period.
The increase in net income was attributable to a 13% increase in premiums while policyholder benefits and claims increased by 14%, a
19% increase in net investment income while interest credited to policyholder account balances increased by 3%, and a 17% increase in
other revenues. The increase in premiums, net of the increase in policyholder benefits and claims, added $41 million to net income, net of
income tax, which was primarily due to additional business in-force from facultative and automatic treaties and renewal premiums on
existing blocks of business in the U.S. and international operations. Policyholder benefits and claims as a percentage of premiums were
81% and are comparable to the prior year. The increase in net investment income, net of interest credited to policyholder account
balances, added $85 million to net income and was due primarily to growth in the invested asset base. The increases in invested assets
and net investment income, net of interest credited to policyholder account balances were substantially derived from the issuance of
notes, which also increased interest expense within other expenses as described below. Additionally, positive operating cash flows and
additional policyholder account balances contributed to the growth in the invested asset base. The increase in other revenues added
$7 million to net income, net of income tax, and was primarily related to an increase in investment product fees on asset-intensive business
and financial reinsurance fees during 2007.
A decrease in other expenses added $1 million to net income, net of income tax. The decrease in other expenses was primarily related
to a reduction of expenses associated with DAC, including reinsurance allowances paid, offset by an increase in interest, expense
compensation and overhead-related expenses associated with RGA’s international expansion, and minority interest expense. The increase
in interest expense is associated with the issuance of $850 million 30-year notes in June 2006 by a subsidiary of RGA to provide long-term
collateral for Regulation XXX statutory reserves, RGA’s issuance of $300 million senior notes in March 2007, and FIN 48 interest expense.
These increases in net income were partially offset by a $120 million increase in net investment losses, net of income tax. The increase
in net investment losses was primarily due to a decrease in the fair value of embedded derivatives associated with the reinsurance of
annuity products on a funds withheld basis.
Additionally, a component of the increase in net income was a $4 million increase associated with foreign currency exchange rate
movements.
Revenues
Total revenues, excluding net investment gains (losses), increased by $712 million, or 14%, to $5,858 million for the twelve months
ended December 31, 2007 from $5,146 million for the comparable 2006 period.
The increase in revenues was primarily associated with growth in premiums of $562 million from new facultative and automatic treaties
and renewal premiums on existing blocks of business in all RGA operating segments, including the U.S., which contributed $221 million;
Asia Pacific, which contributed $192 million; Europe and South Africa, which contributed $91 million; and Canada, which contributed
$58 million. Premium levels are significantly influenced by large transactions and reporting practices of ceding companies and, as a result,
can fluctuate from period to period.
Net investment income increased by $139 million primarily due to growth in the invested asset base from net proceeds from the
aforementioned notes offerings by RGA and its subsidiary, positive cash flows from operations, additional deposits associated with the
coinsurance of annuity products, and a realignment of economic capital. The investment yield also increased slightly over the comparable
prior year.
Other revenues increased by $11 million primarily due to an increase in surrender charges on asset-intensive business reinsured and an
increase in fees associated with financial reinsurance.
38 MetLife, Inc.