MetLife 2007 Annual Report Download - page 121
Download and view the complete annual report
Please find page 121 of the 2007 MetLife annual report below. You can navigate through the pages in the report by either clicking on the pages listed below, or by using the keyword search tool below to find specific information within the annual report.-
 1
1 -
2
-
3
-
4
-
5
-
6
-
7
-
8
-
9
-
10
-
11
-
12
-
13
-
14
-
15
-
16
-
17
-
18
-
19
-
20
-
21
-
22
-
23
-
24
-
25
-
26
-
27
-
28
-
29
-
30
-
31
-
32
-
33
-
34
-
35
-
36
-
37
-
38
-
39
-
40
-
41
-
42
-
43
-
44
-
45
-
46
-
47
-
48
-
49
-
50
-
51
-
52
-
53
-
54
-
55
-
56
-
57
-
58
-
59
-
60
-
61
-
62
-
63
-
64
-
65
-
66
-
67
-
68
-
69
-
70
-
71
-
72
-
73
-
74
-
75
-
76
-
77
-
78
-
79
-
80
-
81
-
82
-
83
-
84
-
85
-
86
-
87
-
88
-
89
-
90
-
91
-
92
-
93
-
94
-
95
-
96
-
97
-
98
-
99
-
100
-
101
-
102
-
103
-
104
-
105
-
106
-
107
-
108
-
109
-
110
-
 111
111 -
 112
112 -
 113
113 -
 114
114 -
 115
115 -
 116
116 -
 117
117 -
 118
118 -
 119
119 -
 120
120 -
 121
121 -
 122
122 -
 123
123 -
 124
124 -
 125
125 -
 126
126 -
 127
127 -
 128
128 -
 129
129 -
 130
130 -
 131
131 -
132
-
133
-
134
-
135
-
136
-
137
-
138
-
139
-
140
-
141
-
142
-
143
-
144
-
145
-
146
-
147
-
148
-
149
-
150
-
151
-
152
-
153
-
154
-
155
-
156
-
157
-
158
-
159
-
160
-
161
-
162
-
163
-
164
-
165
-
166
-
167
-
168
-
169
-
170
-
171
-
172
-
173
-
174
-
175
-
176
-
177
-
178
-
179
-
180
-
181
-
182
-
183
-
184
 |
 |

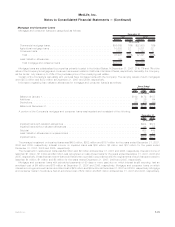
3. Investments
Fixed Maturity and Equity Securities Available-for-Sale
The following tables present the cost or amortized cost, gross unrealized gain and loss, and estimated fair value of the Company’s fixed
maturity and equity securities, the percentage that each sector represents by the total fixed maturity securities holdings and by the total
equity securities holdings at:
Cost or
Amortized
Cost Gain Loss Estimated
Fair Value %of
Total
Gross Unrealized
December 31, 2007
(In millions)
U.S.corporatesecurities................................ $ 77,875 $1,725 $2,174 $ 77,426 32.0%
Residential mortgage-backed securities . . . . . . . . . . . . . . . . . . . . . . 56,267 611 389 56,489 23.3
Foreigncorporatesecurities.............................. 37,359 1,740 794 38,305 15.8
U.S.Treasury/agencysecurities............................ 19,771 1,487 13 21,245 8.8
Commercialmortgage-backedsecurities...................... 17,676 251 199 17,728 7.3
Foreigngovernmentsecurities ............................ 13,535 1,924 188 15,271 6.3
Asset-backedsecurities ................................ 11,549 41 549 11,041 4.6
State and political subdivision securities . . . . . . . . . . . . . . . . . . . . . . 4,394 140 115 4,419 1.8
Otherfixedmaturitysecurities............................. 335 13 30 318 0.1
Total fixed maturity securities . . . . . . . . . . . . . . . . . . . . . . . . . . . . $238,761 $7,932 $4,451 $242,242 100.0%
Commonstock ...................................... $ 2,488 $ 568 $ 108 $ 2,948 48.7%
Non-redeemablepreferredstock........................... 3,403 61 362 3,102 51.3
Total equity securities . . . . . . . . . . . . . . . . . . . . . . . . . . . . . . . . . $ 5,891 $ 629 $ 470 $ 6,050 100.0%
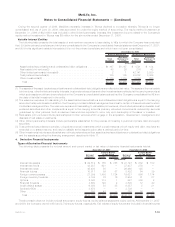
Cost or
Amortized
Cost Gain Loss Estimated
Fair Value %of
Total
Gross Unrealized
December 31, 2006
(In millions)
U.S.corporatesecurities................................ $ 74,010 $2,047 $ 983 $ 75,074 31.0%
Residential mortgage-backed securities . . . . . . . . . . . . . . . . . . . . . . 51,602 385 321 51,666 21.4
Foreigncorporatesecurities.............................. 33,029 1,687 378 34,338 14.2
U.S.Treasury/agencysecurities ........................... 29,897 984 248 30,633 12.7
Commercialmortgage-backedsecurities...................... 16,467 193 138 16,522 6.8
Foreigngovernmentsecurities ............................ 11,406 1,835 34 13,207 5.4
Asset-backedsecurities ................................ 13,851 75 53 13,873 5.7
Stateandpoliticalsubdivisionsecurities...................... 6,121 230 51 6,300 2.6
Otherfixedmaturitysecurities............................. 385 7 77 315 0.2
Total fixed maturity securities . . . . . . . . . . . . . . . . . . . . . . . . . . . . $236,768 $7,443 $2,283 $241,928 100.0%
Commonstock ...................................... $ 1,798 $ 487 $ 16 $ 2,269 44.5%
Non-redeemablepreferredstock........................... 2,751 103 29 2,825 55.5
Total equity securities . . . . . . . . . . . . . . . . . . . . . . . . . . . . . . . . . $ 4,549 $ 590 $ 45 $ 5,094 100.0%
The Company held foreign currency derivatives with notional amounts of $9.2 billion and $8.9 billion to hedge the exchange rate risk
associated with foreign denominated fixed maturity securities at December 31, 2007 and 2006, respectively.
The Company is not exposed to any significant concentrations of credit risk in its equity securities portfolio. The Company is exposed to
concentrations of credit risk related to U.S. Treasury securities and obligations of U.S. government corporations and agencies. Addi-
tionally, at December 31, 2007 and 2006, the Company had exposure to fixed maturity securities backed by sub-prime mortgages with
estimated fair values of $2.2 billion and $3.0 billion, respectively, and unrealized losses of $219 million and $5 million, respectively. These
securities are classified within asset-backed securities in the immediately preceding table. At December 31, 2007, 32% have been
guaranteed by financial guarantors, of which 55% was guaranteed by financial guarantors who remain Aaa rated in 2008. Overall, at
December 31, 2007, $6.7 billion of the estimated fair value of the Company’s fixed maturity securities were credit enhanced by financial
guarantors of which $2.5 billion, $2.5 billion and $1.7 billion at December 31, 2007, are included within state and political subdivisions,
corporate securities and asset-backed securities, respectively, and 80% were guaranteed by financial guarantors who remain Aaa rated in
2008.
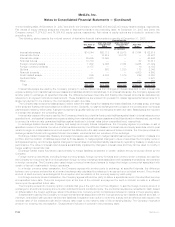
The Company held fixed maturity securities at estimated fair values that were below investment grade or not rated by an independent
rating agency that totaled $17.7 billion and $17.3 billion at December 31, 2007 and 2006, respectively. These securities had net unrealized
gains (losses) of ($108) million and $627 million at December 31, 2007 and 2006, respectively. Non-income producing fixed maturity
securities were $13 million and $16 million at December 31, 2007 and 2006, respectively. Net unrealized gains associated with non-
income producing fixed maturity securities were $12 million and $4 million at December 31, 2007 and 2006, respectively.
F-25MetLife, Inc.
MetLife, Inc.
Notes to Consolidated Financial Statements — (Continued)