MetLife 2007 Annual Report Download - page 66
Download and view the complete annual report
Please find page 66 of the 2007 MetLife annual report below. You can navigate through the pages in the report by either clicking on the pages listed below, or by using the keyword search tool below to find specific information within the annual report.-
 1
1 -
2
-
3
-
4
-
5
-
6
-
7
-
8
-
9
-
10
-
11
-
12
-
13
-
14
-
15
-
16
-
17
-
18
-
19
-
20
-
21
-
22
-
23
-
24
-
25
-
26
-
27
-
28
-
29
-
30
-
31
-
32
-
33
-
34
-
35
-
36
-
37
-
38
-
39
-
40
-
41
-
42
-
43
-
44
-
45
-
46
-
47
-
48
-
49
-
50
-
51
-
52
-
53
-
54
-
55
-
 56
56 -
 57
57 -
 58
58 -
 59
59 -
 60
60 -
 61
61 -
 62
62 -
 63
63 -
 64
64 -
 65
65 -
 66
66 -
 67
67 -
 68
68 -
 69
69 -
 70
70 -
 71
71 -
 72
72 -
 73
73 -
 74
74 -
 75
75 -
 76
76 -
77
-
78
-
79
-
80
-
81
-
82
-
83
-
84
-
85
-
86
-
87
-
88
-
89
-
90
-
91
-
92
-
93
-
94
-
95
-
96
-
97
-
98
-
99
-
100
-
101
-
102
-
103
-
104
-
105
-
106
-
107
-
108
-
109
-
110
-
111
-
112
-
113
-
114
-
115
-
116
-
117
-
118
-
119
-
120
-
121
-
122
-
123
-
124
-
125
-
126
-
127
-
128
-
129
-
130
-
131
-
132
-
133
-
134
-
135
-
136
-
137
-
138
-
139
-
140
-
141
-
142
-
143
-
144
-
145
-
146
-
147
-
148
-
149
-
150
-
151
-
152
-
153
-
154
-
155
-
156
-
157
-
158
-
159
-
160
-
161
-
162
-
163
-
164
-
165
-
166
-
167
-
168
-
169
-
170
-
171
-
172
-
173
-
174
-
175
-
176
-
177
-
178
-
179
-
180
-
181
-
182
-
183
-
184
 |
 |

At the end of 2007, total net actuarial losses were $623 million as compared to $1,123 million in 2006. In 2007, the majority of the
reduction in the actuarial losses is due to the increase in the discount rate to 6.65% in 2007 from 6.00% in 2006. These losses will be
amortized on a straight-line basis over the average remaining service period of active employees expected to receive benefits under the
benefit plans. At the end of 2007, the average remaining service period of active employees was 8.2 years for the pension plans.
As the benefits provided under the defined pension plans are calculated as a percentage of future earnings, an assumption of future
compensation increases is required to determine the projected benefit obligation. These rates are derived through periodic analysis of
historical demographic data conducted by an independent actuarial firm. The last review of such data was conducted using salary
information through 2006 and the Company believes that no circumstances have subsequently occurred that would result in a material
change to the compensation rate assumptions.
Other Postretirement Benefit Plan Obligations
The APBO is determined using a variety of actuarial assumptions, from which actual results may vary. Some of the more significant of
these assumptions include the discount rate, the healthcare cost trend rate and the average expected retirement age. The determination of
the discount rate and the average expected retirement age are substantially consistent with the determination described previously for the
pension plans.
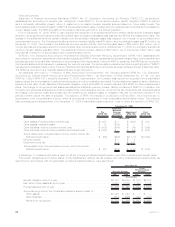
The assumed healthcare cost trend rates used in measuring the APBO and net periodic benefit cost were as follows:
2007 2006
December 31,
Pre-Medicare eligible claims . . . . . . . . . . . . . . . . . . . . . 8.5% down to 5% in 2014 9.0% down to 5% in 2014
Medicare eligible claims . . . . . . . . . . . . . . . . . . . . . . . . 10.5% down to 5% in 2018 11.0% down to 5% in 2018
Assumed healthcare cost trend rates may have a significant effect on the amounts reported for healthcare plans. A one-percentage
point change in assumed healthcare cost trend rates would have the following effects:
One Percent
Increase One Percent
Decrease
(In millions)
Effectontotalofserviceandinterestcostcomponents.......................... $ 7 $ (6)
Effectofaccumulatedpostretirementbenefitobligation.......................... $63 $(62)
A decrease (increase) in the discount rate increases (decreases) the APBO. This increase (decrease) to the APBO is amortized into
earnings as an actuarial loss (gain). Based on the December 31, 2007 APBO, a 25 basis point decrease (increase) in the discount rate
would result in an increase (decrease) in the APBO of $44 million.
At the end of 2007, total net actuarial gains were $112 million as compared to net actuarial losses of $328 million in 2006. The majority
of the net actuarial gains are due to the increase in the discount rate, an increased number of retirees opting out of plan benefits and lower
than expected medical inflation. These gains will be amortized on a straight-line basis over the average remaining service period of active
employees expected to receive benefits under the other postretirement benefit plans. At the end of 2007, the average remaining service
period of active employees was 8.3 years for the other postretirement benefit plans.
In 2004, the Company adopted the guidance in FSP 106-2 Accounting and Disclosure Requirements Related to the Medicare
Prescription Drug, Improvement and Modernization Act of 2003 (“FSP 106-2”), to account for future subsidies to be received under the
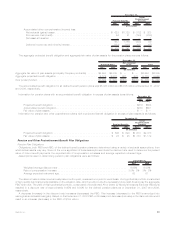
Prescription Drug Act. The Company began receiving these subsidies during 2006. A summary of the reduction to the APBO and related
reduction to the components of net periodic other postretirement benefit cost is as follows:
2007 2006 2005
December 31,
(In millions)
Cumulative reduction in benefit obligation:
Beginningofyear................................................ $328 $298 $230
Servicecost................................................... 7 6 6
Interestcost................................................... 19 19 16
Netactuarialgains(losses) ......................................... (42) 15 46
Prescriptiondrugsubsidy .......................................... (13) (10) —
Endofyear.................................................. $299 $328 $298
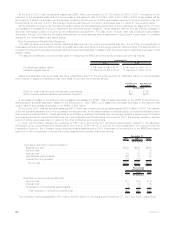
2007 2006 2005
Years Ended
December 31,
(In millions)
Reduction in net periodic benefit cost:
Servicecost.................................................... $ 7 $ 6 $ 6
Interestcost .................................................... 19 19 16
Amortizationofnetactuarialgains(losses)................................. 5 30 23
Totalreductioninnetperiodicbenefitcost ............................... $31 $55 $45
The Company received subsidies of $10 million and $8 million for the years ended December 31, 2007 and 2006, respectively.
62 MetLife, Inc.