MetLife 2007 Annual Report Download - page 68
Download and view the complete annual report
Please find page 68 of the 2007 MetLife annual report below. You can navigate through the pages in the report by either clicking on the pages listed below, or by using the keyword search tool below to find specific information within the annual report.-
 1
1 -
2
-
3
-
4
-
5
-
6
-
7
-
8
-
9
-
10
-
11
-
12
-
13
-
14
-
15
-
16
-
17
-
18
-
19
-
20
-
21
-
22
-
23
-
24
-
25
-
26
-
27
-
28
-
29
-
30
-
31
-
32
-
33
-
34
-
35
-
36
-
37
-
38
-
39
-
40
-
41
-
42
-
43
-
44
-
45
-
46
-
47
-
48
-
49
-
50
-
51
-
52
-
53
-
54
-
55
-
56
-
57
-
 58
58 -
 59
59 -
 60
60 -
 61
61 -
 62
62 -
 63
63 -
 64
64 -
 65
65 -
 66
66 -
 67
67 -
 68
68 -
 69
69 -
 70
70 -
 71
71 -
 72
72 -
 73
73 -
 74
74 -
 75
75 -
 76
76 -
 77
77 -
 78
78 -
79
-
80
-
81
-
82
-
83
-
84
-
85
-
86
-
87
-
88
-
89
-
90
-
91
-
92
-
93
-
94
-
95
-
96
-
97
-
98
-
99
-
100
-
101
-
102
-
103
-
104
-
105
-
106
-
107
-
108
-
109
-
110
-
111
-
112
-
113
-
114
-
115
-
116
-
117
-
118
-
119
-
120
-
121
-
122
-
123
-
124
-
125
-
126
-
127
-
128
-
129
-
130
-
131
-
132
-
133
-
134
-
135
-
136
-
137
-
138
-
139
-
140
-
141
-
142
-
143
-
144
-
145
-
146
-
147
-
148
-
149
-
150
-
151
-
152
-
153
-
154
-
155
-
156
-
157
-
158
-
159
-
160
-
161
-
162
-
163
-
164
-
165
-
166
-
167
-
168
-
169
-
170
-
171
-
172
-
173
-
174
-
175
-
176
-
177
-
178
-
179
-
180
-
181
-
182
-
183
-
184
 |
 |

of the accumulated postretirement plan benefit obligation or the market-related value of plan assets, they are amortized into
other postretirement benefit expense over the expected service years of the employees.
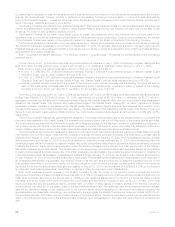
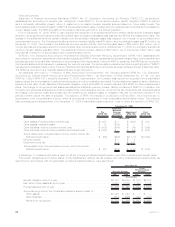
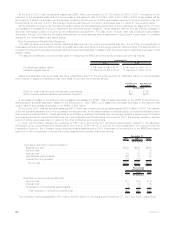
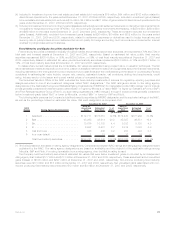
The Subsidiaries recognized other postretirement benefit expense of $9 million in 2007 as compared to $60 million in 2006 and
$77 million in 2005. The major components of net periodic other postretirement benefit cost described above were as follows:
2007 2006 2005
Years Ended
December 31,
(In millions)
Servicecost...................................................... $ 27 $ 35 $ 37
Interestcost...................................................... 104 117 121
Expectedreturnonplanassets.......................................... (86) (79) (79)
Amortizationofnetactuarial(gains)losses................................... — 23 15
Amortizationofpriorservicecost(credit).................................... (36) (36) (17)
Netperiodicbenefitcost............................................. $ 9 $ 60 $ 77
The decrease in benefit cost from 2005 to 2006 was due to changes in plan benefits resulting in decreased service and interest cost
and increases in amortization of prior service costs. The continued decrease from 2006 to 2007 primarily resulted from a change in the
Medicare integration methodology for certain retirees.
The estimated net actuarial losses and prior service credit for the other postretirement benefit plans that will be amortized from
accumulated other comprehensive income into net periodic benefit cost over the next year are less than $1 million and $37 million,
respectively.
The weighted average discount rate used to calculate the net periodic postretirement cost was 6.00%, 5.82% and 5.98% for the years
ended December 31, 2007, 2006 and 2005, respectively.
The weighted average expected rate of return on plan assets used to calculate the net other postretirement benefit cost for the years
ended December 31, 2007, 2006 and 2005 was 7.47%, 7.42% and 7.51%, respectively. The expected rate of return on plan assets is
based on anticipated performance of the various asset sectors in which the plan invests, weighted by target allocation percentages.
Anticipated future performance is based on long-term historical returns of the plan assets by sector, adjusted for the Subsidiaries’ long-
term expectations on the performance of the markets. While the precise expected return derived using this approach will fluctuate from
year to year, the Subsidiaries’ policy is to hold this long-term assumption constant as long as it remains within reasonable tolerance from
the derived rate. The actual net return on the investments has been an approximation of the estimated return for the other postretirement
plans in 2007, 2006 and 2005.
Based on the December 31, 2007 asset balances, a 25 basis point increase (decrease) in the expected rate of return on plan assets
would result in a decrease (increase) in net periodic benefit cost of $3 million for the other postretirement plans.
Pension and Other Postretirement Benefit Plan Assets
Pension Plan Assets
Substantially all assets of the pension plans are invested within group annuity and life insurance contracts issued by the Subsidiaries.
The majority of assets are held in separate accounts established by the Subsidiaries. The account values of assets held with the
Subsidiaries were $6,440 million and $6,205 million as of December 31, 2007 and 2006, respectively. The terms of these contracts are
consistent in all material respects with those the Subsidiaries offer to unaffiliated parties that are similarly situated.
Net assets invested in separate accounts are stated at the aggregate fair value of units of participation. Such value reflects
accumulated contributions, dividends and realized and unrealized investment gains or losses apportioned to such contributions, less
withdrawals, distributions, allocable expenses relating to the purchase, sale and maintenance of the assets and an allocable part of such
separate accounts’ investment expenses.
Separate account investments in fixed income and equity securities are generally carried at published market value, or if published
market values are not readily available, at estimated market values. Investments in short-term fixed income securities are generally reflected
as cash equivalents and carried at fair value. Real estate investments are carried at estimated fair value based on appraisals performed by
third-party real estate appraisal firms, and generally, determined by discounting projected cash flows over periods of time and at interest
rates deemed appropriate for each investment. Information on the physical value of the property and the sales prices of comparable
properties is used to corroborate fair value estimates. Estimated fair value of hedge fund net assets is generally determined by third-party
pricing vendors using quoted market prices or through the use of pricing models which are affected by changes in interest rates, foreign
currency exchange rates, financial indices, credit spreads, market supply and demand, market volatility and liquidity.
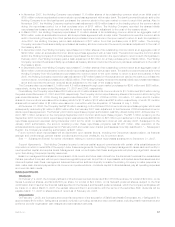
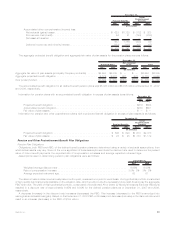
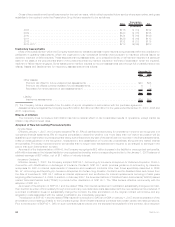
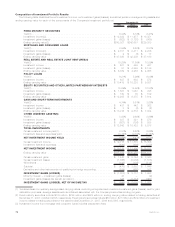
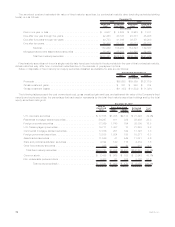
The following table summarizes the actual and target weighted-average allocations of pension plan assets within the separate
accounts:
2007 2006 2008
Weighted
Average
Actual
Allocation
Weighted
Average
Targe t
Allocation
December 31,
Asset Category
Equitysecurities ................................................... 38% 42% 30%-55%
Fixedmaturities.................................................... 44% 42% 30%-65%
Other(RealEstateandAlternativeinvestments) ............................... 18% 16% 10%-25%
Total.......................................................... 100% 100%
64 MetLife, Inc.