MetLife 2007 Annual Report Download - page 22
Download and view the complete annual report
Please find page 22 of the 2007 MetLife annual report below. You can navigate through the pages in the report by either clicking on the pages listed below, or by using the keyword search tool below to find specific information within the annual report.-
 1
1 -
2
-
3
-
4
-
5
-
6
-
7
-
8
-
9
-
10
-
11
-
 12
12 -
 13
13 -
 14
14 -
 15
15 -
 16
16 -
 17
17 -
 18
18 -
 19
19 -
 20
20 -
 21
21 -
 22
22 -
 23
23 -
 24
24 -
 25
25 -
 26
26 -
 27
27 -
 28
28 -
 29
29 -
 30
30 -
 31
31 -
 32
32 -
33
-
34
-
35
-
36
-
37
-
38
-
39
-
40
-
41
-
42
-
43
-
44
-
45
-
46
-
47
-
48
-
49
-
50
-
51
-
52
-
53
-
54
-
55
-
56
-
57
-
58
-
59
-
60
-
61
-
62
-
63
-
64
-
65
-
66
-
67
-
68
-
69
-
70
-
71
-
72
-
73
-
74
-
75
-
76
-
77
-
78
-
79
-
80
-
81
-
82
-
83
-
84
-
85
-
86
-
87
-
88
-
89
-
90
-
91
-
92
-
93
-
94
-
95
-
96
-
97
-
98
-
99
-
100
-
101
-
102
-
103
-
104
-
105
-
106
-
107
-
108
-
109
-
110
-
111
-
112
-
113
-
114
-
115
-
116
-
117
-
118
-
119
-
120
-
121
-
122
-
123
-
124
-
125
-
126
-
127
-
128
-
129
-
130
-
131
-
132
-
133
-
134
-
135
-
136
-
137
-
138
-
139
-
140
-
141
-
142
-
143
-
144
-
145
-
146
-
147
-
148
-
149
-
150
-
151
-
152
-
153
-
154
-
155
-
156
-
157
-
158
-
159
-
160
-
161
-
162
-
163
-
164
-
165
-
166
-
167
-
168
-
169
-
170
-
171
-
172
-
173
-
174
-
175
-
176
-
177
-
178
-
179
-
180
-
181
-
182
-
183
-
184
 |
 |
• Other expenses increased in India primarily due to headcount increases and growth initiatives, partially offset by the impact of
management’s update of assumptions used to determine estimated gross profits.
• Other expenses increased in Australia primarily due to business growth and changes in foreign currency exchange rates.
• Other expenses increased in Chile primarily due to compensation costs, infrastructure and marketing programs, and growth partially
offset by a decrease in DAC amortization related to inflation indexing.
• Other expenses increased in Hong Kong due to the acquisition of the remaining 50% interest in MetLife Fubon and the resulting
consolidation of the operation.
• Ireland’s other expenses increased due to higher start-up costs, as well as foreign currency transaction losses.
• Brazil’s other expenses increased due to changes in foreign currency exchange rates partially offset by an increase in litigation
liabilities in the prior year.
• The United Kingdom’s other expenses increased due to changes in foreign currency exchange rates and higher spending on
business initiatives partially offset by lower DAC amortization resulting from calculation refinements.
• These increases in other expenses were partially offset by a decrease in Taiwan’s other expenses primarily due to a one-time increase
in DAC amortization in the prior year due to a loss recognition adjustment resulting from low interest rates related to product
guarantees coupled with high persistency rates on certain blocks of business, an increase in DAC amortization in the prior year
associated with the implementation of a new valuation system, as well as one-time expenses in the prior year related to the
termination of the agency force, and expense reductions recognized in the current year due to the elimination of the agency force.
Other expenses decreased in the home office primarily due to the elimination of certain intercompany expenses previously charged to
the International segment, offset by higher spending on growth and infrastructure initiatives.
The Institutional segment contributed to the year over year increase primarily due to an increase in non-deferrable volume-related and
corporate support expenses, higher DAC amortization associated with the ongoing implementation of SOP 05-1 in the current year, a
charge related to the reimbursement of dental claims in the current year, the establishment of a contingent legal liability in the current year
and the impact of certain revisions in both years. These increases were partially offset by a benefit related to a reduction of an allowance for
doubtful accounts in the current year, the impact of a charge of non-deferrable LTC commissions expense, a charge associated with costs
related to the sale of certain small market record keeping businesses and a regulatory settlement, all in the prior year.
Corporate & Other contributed to the year over year increase in other expenses primarily due to higher interest expense, higher interest
on tax contingences and an increase in interest credited to bankholder deposits at MetLife Bank, National Association, a national bank
(“MetLife Bank” or “MetLife Bank, N.A.”), partially offset by lower corporate support expenses, lower costs from reductions of MetLife
Foundation contributions, integration costs incurred in the prior year and lower legal costs.
These increases in other expenses were partially offset by a decrease in the Auto & Home segment primarily related to lower information
technology and advertising costs, partially offset by minor changes in a variety of expense categories.
These increases in other expenses were partially offset by a decrease in the Reinsurance segment primarily due to a decrease in
expenses associated with DAC, partially offset by an increase in interest expense associated with note offerings in both years, an increase
in minority interest expense, as well as an increase in compensation and overhead-related expenses associated with RGA’s international
expansion and general growth in the operations.
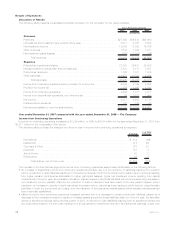
Net Income
Income tax expense for the year ended December 31, 2007 was $1,759 million, or 29% of income from continuing operations before
provision for income tax, compared with $1,097 million, or 26% of such income, for the comparable 2006 period. The 2007 and 2006
effective tax rates differ from the corporate tax rate of 35% primarily due to the impact of non-taxable investment income and tax credits for
investments in low income housing. In addition, the increase in the effective rate for FIN 48 liability additions is entirely offset by an increase
in non-taxable investment income. The 2007 period includes a benefit for decrease in international deferred tax valuation allowances and
the 2006 period included a prior year benefit for international taxes. Lastly, the 2006 period included benefit for a “provision-to-filed return”
adjustment regarding non-taxable investment income.
Income from discontinued operations, net of income tax, decreased by $3,185 million, or 99%, to $37 million for the year ended
December 31, 2007 from $3,222 million for the comparable 2006 period. The decrease in income from discontinued operations was
primarily due a gain of $3 billion, net of income tax, on the sale of the Peter Cooper Village and Stuyvesant Town properties in Manhattan,
New York, that was recognized during the year ended December 31, 2006. In addition, there was lower net investment income and net
investment gains (losses) of $144 million, net of income tax, from discontinued operations related to real estate properties sold or held-for-
sale during the year ended December 31, 2007 as compared to the year ended December 31, 2006. Also contributing to the decrease
was lower income from discontinued operations of $23 million, net of income tax, related to the sale of MetLife Australia’s annuities and
pension businesses to a third party in the third quarter of 2007 and lower income from discontinued operations of $18 million, net of
income tax, related to the sale of SSRM resulting from a reduction in additional proceeds from the sale received during the year ended
December 31, 2007 as compared to the year December 31, 2006.
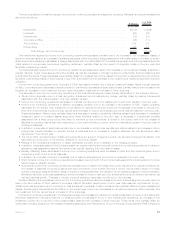
Year ended December 31, 2006 compared with the year ended December 31, 2005 — The Company
Income from Continuing Operations
Income from continuing operations was $3,071 million for the years ended December 31, 2006 and December 31, 2005. Excluding the
acquisition of Travelers, which contributed $298 million during the first six months of 2006 to the year over year increase, income from
continuing operations decreased by $298 million. Income from continuing operations for the years ended December 31, 2006 and 2005
included the impact of certain transactions or events, the timing, nature and amount of which are generally unpredictable. These
transactions are described in each applicable segment’s discussion. These items contributed a charge of $23 million, net of income tax, to
the year ended December 31, 2006. These items contributed a benefit of $48 million, net of income tax, to the year ended December 31,
2005. Excluding the impact of these items and the acquisition of Travelers, income from continuing operations decreased by $227 million
for the year ended December 31, 2006 compared to the prior 2005 period.
18 MetLife, Inc.