MetLife 2007 Annual Report Download - page 78
Download and view the complete annual report
Please find page 78 of the 2007 MetLife annual report below. You can navigate through the pages in the report by either clicking on the pages listed below, or by using the keyword search tool below to find specific information within the annual report.-
 1
1 -
2
-
3
-
4
-
5
-
6
-
7
-
8
-
9
-
10
-
11
-
12
-
13
-
14
-
15
-
16
-
17
-
18
-
19
-
20
-
21
-
22
-
23
-
24
-
25
-
26
-
27
-
28
-
29
-
30
-
31
-
32
-
33
-
34
-
35
-
36
-
37
-
38
-
39
-
40
-
41
-
42
-
43
-
44
-
45
-
46
-
47
-
48
-
49
-
50
-
51
-
52
-
53
-
54
-
55
-
56
-
57
-
58
-
59
-
60
-
61
-
62
-
63
-
64
-
65
-
66
-
67
-
 68
68 -
 69
69 -
 70
70 -
 71
71 -
 72
72 -
 73
73 -
 74
74 -
 75
75 -
 76
76 -
 77
77 -
 78
78 -
 79
79 -
 80
80 -
 81
81 -
 82
82 -
 83
83 -
 84
84 -
 85
85 -
 86
86 -
 87
87 -
 88
88 -
89
-
90
-
91
-
92
-
93
-
94
-
95
-
96
-
97
-
98
-
99
-
100
-
101
-
102
-
103
-
104
-
105
-
106
-
107
-
108
-
109
-
110
-
111
-
112
-
113
-
114
-
115
-
116
-
117
-
118
-
119
-
120
-
121
-
122
-
123
-
124
-
125
-
126
-
127
-
128
-
129
-
130
-
131
-
132
-
133
-
134
-
135
-
136
-
137
-
138
-
139
-
140
-
141
-
142
-
143
-
144
-
145
-
146
-
147
-
148
-
149
-
150
-
151
-
152
-
153
-
154
-
155
-
156
-
157
-
158
-
159
-
160
-
161
-
162
-
163
-
164
-
165
-
166
-
167
-
168
-
169
-
170
-
171
-
172
-
173
-
174
-
175
-
176
-
177
-
178
-
179
-
180
-
181
-
182
-
183
-
184
 |
 |

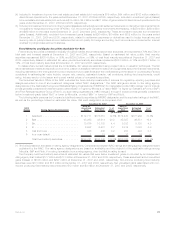
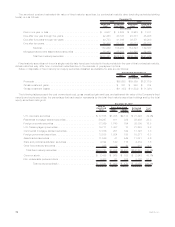
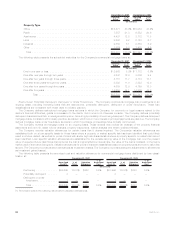
The amortized cost and estimated fair value of fixed maturity securities, by contractual maturity date (excluding scheduled sinking
funds), are as follows:
Amortized
Cost Estimated
Fair Value Amortized
Cost Estimated
Fair Value
2007 2006
December 31,
(In millions)
Dueinoneyearorless............................... $ 4,537 $ 4,628 $ 6,923 $ 7,011
Due after one year through five years . . . . . . . . . . . . . . . . . . . . . . 42,453 43,167 45,331 45,928
Due after five years through ten years . . . . . . . . . . . . . . . . . . . . . 40,783 41,046 39,571 40,200
Dueaftertenyears.................................. 65,496 68,143 63,023 66,728
Subtotal . . . . . . . . . . . . . . . . . . . . . . . . . . . . . . . . . . . 153,269 156,984 154,848 159,867
Mortgage-backed and asset-backed securities . . . . . . . . . . . . . . . 85,492 85,258 81,920 82,061
Total fixed maturity securities . . . . . . . . . . . . . . . . . . . . . $238,761 $242,242 $236,768 $241,928
Fixed maturity securities not due at a single maturity date have been included in the above table in the year of final contractual maturity.
Actual maturities may differ from contractual maturities due to the exercise of prepayment options.
Sales or disposals of fixed maturity and equity securities classified as available-for-sale are as follows:
2007 2006 2005
Years Ended December 31,
(In millions)
Proceeds.................................................. $80,685 $89,869 $127,709
Grossinvestmentgains......................................... $ 831 $ 580 $ 704
Grossinvestmentlosses........................................ $(1,183) $(1,533) $ (1,391)
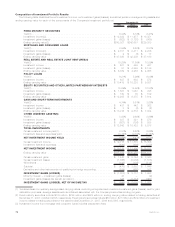
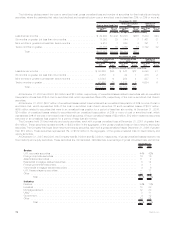
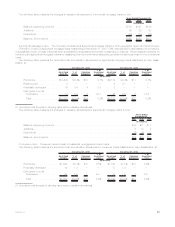
The following tables present the cost or amortized cost, gross unrealized gain and loss, and estimated fair value of the Company’s fixed
maturity and equity securities, the percentage that each sector represents by the total fixed maturity securities holdings and by the total
equity securities holdings at:
Cost or
Amortized
Cost Gain Loss Estimated
Fair Value %of
Tot al
Gross Unrealized
December 31, 2007
(In millions)
U.S.corporatesecurities ........................... $ 77,875 $1,725 $2,174 $ 77,426 32.0%
Residential mortgage-backed securities . . . . . . . . . . . . . . . . . . 56,267 611 389 56,489 23.3
Foreign corporate securities . . . . . . . . . . . . . . . . . . . . . . . . . 37,359 1,740 794 38,305 15.8
U.S. Treasury/agency securities . . . . . . . . . . . . . . . . . . . . . . . 19,771 1,487 13 21,245 8.8
Commercial mortgage-backed securities . . . . . . . . . . . . . . . . . 17,676 251 199 17,728 7.3
Foreign government securities . . . . . . . . . . . . . . . . . . . . . . . . 13,535 1,924 188 15,271 6.3
Asset-backedsecurities............................ 11,549 41 549 11,041 4.6
State and political subdivision securities . . . . . . . . . . . . . . . . . 4,394 140 115 4,419 1.8
Otherfixedmaturitysecurities........................ 335 13 30 318 0.1
Total fixed maturity securities . . . . . . . . . . . . . . . . . . . . . . . $238,761 $7,932 $4,451 $242,242 100.0%
Commonstock.................................. $ 2,488 $ 568 $ 108 $ 2,948 48.7%
Non-redeemablepreferredstock ...................... 3,403 61 362 3,102 51.3
Total equity securities(1) . . . . . . . . . . . . . . . . . . . . . . $ 5,891 $ 629 $ 470 $ 6,050 100.0%
74 MetLife, Inc.