MetLife 2007 Annual Report Download - page 28
Download and view the complete annual report
Please find page 28 of the 2007 MetLife annual report below. You can navigate through the pages in the report by either clicking on the pages listed below, or by using the keyword search tool below to find specific information within the annual report.-
 1
1 -
2
-
3
-
4
-
5
-
6
-
7
-
8
-
9
-
10
-
11
-
12
-
13
-
14
-
15
-
16
-
17
-
 18
18 -
 19
19 -
 20
20 -
 21
21 -
 22
22 -
 23
23 -
 24
24 -
 25
25 -
 26
26 -
 27
27 -
 28
28 -
 29
29 -
 30
30 -
 31
31 -
 32
32 -
 33
33 -
 34
34 -
 35
35 -
 36
36 -
 37
37 -
 38
38 -
39
-
40
-
41
-
42
-
43
-
44
-
45
-
46
-
47
-
48
-
49
-
50
-
51
-
52
-
53
-
54
-
55
-
56
-
57
-
58
-
59
-
60
-
61
-
62
-
63
-
64
-
65
-
66
-
67
-
68
-
69
-
70
-
71
-
72
-
73
-
74
-
75
-
76
-
77
-
78
-
79
-
80
-
81
-
82
-
83
-
84
-
85
-
86
-
87
-
88
-
89
-
90
-
91
-
92
-
93
-
94
-
95
-
96
-
97
-
98
-
99
-
100
-
101
-
102
-
103
-
104
-
105
-
106
-
107
-
108
-
109
-
110
-
111
-
112
-
113
-
114
-
115
-
116
-
117
-
118
-
119
-
120
-
121
-
122
-
123
-
124
-
125
-
126
-
127
-
128
-
129
-
130
-
131
-
132
-
133
-
134
-
135
-
136
-
137
-
138
-
139
-
140
-
141
-
142
-
143
-
144
-
145
-
146
-
147
-
148
-
149
-
150
-
151
-
152
-
153
-
154
-
155
-
156
-
157
-
158
-
159
-
160
-
161
-
162
-
163
-
164
-
165
-
166
-
167
-
168
-
169
-
170
-
171
-
172
-
173
-
174
-
175
-
176
-
177
-
178
-
179
-
180
-
181
-
182
-
183
-
184
 |
 |
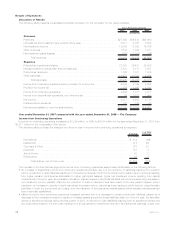
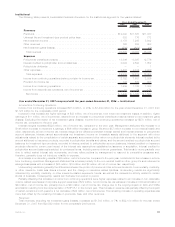
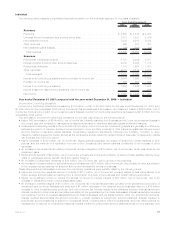
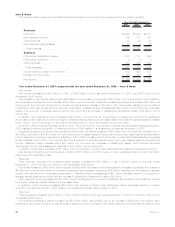
Net investment income increased by $914 million. Management attributes $742 million of this increase to growth in the average asset
base primarily within mortgage loans on real estate, fixed maturity securities, real estate joint ventures, other limited partnership interests,
and equity securities, driven by continued business growth, particularly growth in the funding agreements and global GIC businesses.
Additionally, management attributes $172 million of this increase in net investment income to an increase in yields, primarily due to higher
returns on fixed maturity securities, improved securities lending results, other limited partnership interests, and equity securities, partially
offset by a decline in yields on real estate and real estate joint ventures and mortgage loans.
The increase of $594 million in premiums, fees and other revenues was largely due to increases in the non-medical health & other
business of $483 million, primarily due to growth in the dental, disability, AD&D and IDI businesses of $478 million. Partially offsetting these
increases in the non-medical health & other business is a decline in the LTC business of $7 million, which includes a $66 million decrease
resulting from a shift to deposit liability-type contracts in the current year. Excluding this shift, LTC premiums would have increased due to
growth in the business. Group life increased $345 million, which management primarily attributes to a $262 million increase in term life,
primarily due to growth in the business from new sales and an increase in reinsurance assumed, partially offset by the impact of an increase
in experience rated refunds. In addition, corporate-owned life insurance and life insurance sold to postretirement benefit plans increased
by $65 million and $30 million, respectively. The increase in corporate-owned life insurance is largely attributable to fees earned on a large
sale in the current year. These increases in group life’s premiums, fees and other revenues were partially offset by a decrease of $5 million
in the universal life insurance products. Partially offsetting the increase in premiums, fees and other revenues was a decline in retirement &
savings’ premiums, fees and other revenues of $234 million, primarily from declines of $158 million and $79 million in structured settlement
and pension closeout premiums, respectively, partially offset by an increase of $3 million across several products. The declines in the
structured settlement and pension closeout businesses are predominantly due to the impact of lower sales in the current year. Premiums,
fees and other revenues from retirement & savings products are significantly influenced by large transactions and, as a result, can fluctuate
from period to period.
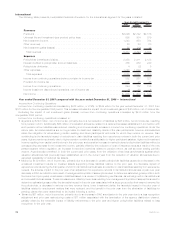
Expenses
Total expenses increased by $1,064 million, or 6%, to $19,338 million for the year ended December 31, 2007 from $18,274 million for
the comparable 2006 period.
The increase in expenses was attributable to higher interest credited to policyholder account balances of $501 million, higher
policyholder benefits and claims of $439 million and an increase in operating expenses of $124 million.
Management attributes the increase of $501 million in interest credited to policyholder account balances to a $352 million increase
solely from growth in the average policyholder account balances, primarily resulting from growth in global GICs and funding agreements
within the retirement & savings business and a $149 million increase from a rise in average crediting rates, largely due to the global GIC
program, coupled with a rise in short-term interest rates in the current year.
The increase in policyholder benefits and claims of $439 million included a $16 million decrease related to net investment gains
(losses). Excluding the decrease related to net investment gains (losses), policyholder benefits and claims increased by $455 million. Non-
medical health & other’s policyholder benefits and claims increased by $385 million. This increase was largely due to a $371 million
increase in the dental, disability, IDI and AD&D businesses, resulting from the aforementioned growth in business. This increase was
partially offset by favorable claim experience in the dental business and favorable morbidity experience in the disability, IDI and AD&D
businesses. This increase included charges related to certain refinements of $14 million in the current year in LTD and the impact of a
$22 million disability liability reduction in the prior year, which contributed to the increase. An increase in LTC of $14 million is largely
attributable to business growth and an increase in interest credited, partially offset by the aforementioned $66 million shift to deposit
liability-type contracts and the impact of more favorable claim experience in the current year. Group life’s policyholder benefits and claims
increased by $264 million due mostly to an increase in the term life business of $245 million, which included the impact of less favorable
mortality in the term life product, partially offset by the net impact of favorable liability refinements of $12 million in the current year. An
increase of $29 million in life insurance sold to postretirement plans and $25 million for other group life products, including corporate-
owned life insurance, also contributed to the increase in policyholder benefits and claims for group life. The increases in term life and life
insurance sold to postretirement benefit plans are commensurate with the aforementioned premiums increases. These increases were
partially offset by a decline in universal group life products of $36 million, primarily due to favorable claim experience. Retirement & savings’
policyholder benefits decreased by $194 million, which was largely due to decreases in the pension closeout and structured settlement
businesses of $98 million and $97 million, respectively. The decrease in pension closeouts was primarily due to the aforementioned
decrease in premiums and a decrease in interest credited. The decline in structured settlements was primarily a result of the aforemen-
tioned decline in premiums, partially offset by an increase in interest credited and less favorable mortality experience in the current year. In
addition, this decrease included the net impact of favorable liability refinements in the current year, which contributed a decrease of
$20 million, and the net impact of favorable liability refinements in the prior year of $57 million, largely related to business associated with
the acquisition of Travelers, principally in the structured settlement, pension closeout and general account businesses.
Higher other expenses of $124 million included an increase in non-deferrable volume-related expenses and corporate support
expenses of $108 million. Non-deferrable volume-related expenses included those expenses associated with direct departmental
spending, information technology, commissions and premium taxes. Corporate support expenses included advertising, corporate over-
head and consulting fees. The increase in other expenses was also attributable to higher DAC amortization of $68 million, primarily due to a
$61 million charge as a result of the ongoing impact of DAC and VOBA amortization resulting from the implementation of SOP 05-1 in the
current year. In addition, a charge of $14 million related to the reimbursement of certain dental claims and a $15 million charge related to
the establishment of a contingent legal liability in the current year contributed to the increase in other expenses. The impact of certain
revisions in both years also contributed to a net increase in other expenses of $2 million. These increases were partially offset by a
$13 million benefit related to a reduction of an allowance for doubtful accounts in the current year. Additionally, the prior year included the
impact of a $22 million charge for non-deferrable LTC commissions expense, a charge of $24 million associated with costs related to the
sale of certain small market recordkeeping businesses and $24 million related to a regulatory settlement, which reduced other expenses in
the current year.
24 MetLife, Inc.