MetLife 2007 Annual Report Download - page 83
Download and view the complete annual report
Please find page 83 of the 2007 MetLife annual report below. You can navigate through the pages in the report by either clicking on the pages listed below, or by using the keyword search tool below to find specific information within the annual report.-
 1
1 -
2
-
3
-
4
-
5
-
6
-
7
-
8
-
9
-
10
-
11
-
12
-
13
-
14
-
15
-
16
-
17
-
18
-
19
-
20
-
21
-
22
-
23
-
24
-
25
-
26
-
27
-
28
-
29
-
30
-
31
-
32
-
33
-
34
-
35
-
36
-
37
-
38
-
39
-
40
-
41
-
42
-
43
-
44
-
45
-
46
-
47
-
48
-
49
-
50
-
51
-
52
-
53
-
54
-
55
-
56
-
57
-
58
-
59
-
60
-
61
-
62
-
63
-
64
-
65
-
66
-
67
-
68
-
69
-
70
-
71
-
72
-
 73
73 -
 74
74 -
 75
75 -
 76
76 -
 77
77 -
 78
78 -
 79
79 -
 80
80 -
 81
81 -
 82
82 -
 83
83 -
 84
84 -
 85
85 -
 86
86 -
 87
87 -
 88
88 -
 89
89 -
 90
90 -
 91
91 -
 92
92 -
 93
93 -
94
-
95
-
96
-
97
-
98
-
99
-
100
-
101
-
102
-
103
-
104
-
105
-
106
-
107
-
108
-
109
-
110
-
111
-
112
-
113
-
114
-
115
-
116
-
117
-
118
-
119
-
120
-
121
-
122
-
123
-
124
-
125
-
126
-
127
-
128
-
129
-
130
-
131
-
132
-
133
-
134
-
135
-
136
-
137
-
138
-
139
-
140
-
141
-
142
-
143
-
144
-
145
-
146
-
147
-
148
-
149
-
150
-
151
-
152
-
153
-
154
-
155
-
156
-
157
-
158
-
159
-
160
-
161
-
162
-
163
-
164
-
165
-
166
-
167
-
168
-
169
-
170
-
171
-
172
-
173
-
174
-
175
-
176
-
177
-
178
-
179
-
180
-
181
-
182
-
183
-
184
 |
 |

to secure the liabilities associated with the short sale agreements in the trading securities portfolio at December 31, 2007 and 2006,
respectively.
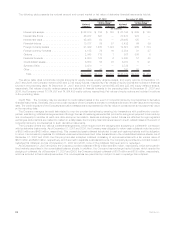
During the years ended December 31, 2007, 2006 and 2005, interest and dividends earned on trading securities in addition to the net
realized and unrealized gains (losses) recognized on the trading securities and the related short sale agreement liabilities included within
net investment income totaled $50 million, $71 million and $14 million, respectively. Included within unrealized gains (losses) on such
trading securities and short sale agreement liabilities, are changes in fair value of ($4) million, $26 million and less than $1 million for the
years ended December 31, 2007, 2006 and 2005, respectively.
As part of the acquisition of Travelers on July 1, 2005, the Company acquired Travelers’ investment in Tribeca Citigroup Investments
Ltd. (“Tribeca”). Tribeca was a feeder fund investment structure whereby the feeder fund invests substantially all of its assets in the master
fund, Tribeca Global Convertible Instruments Ltd. The primary investment objective of the master fund is to achieve enhanced risk-adjusted
return by investing in domestic and foreign equities and equity-related securities utilizing such strategies as convertible securities arbitrage.
At December 31, 2005, MetLife was the majority owner of the feeder fund and consolidated the fund within its consolidated financial
statements. Net investment income related to the trading activities of Tribeca, which included interest and dividends earned on trading
securities in addition to the net realized and unrealized gains, was $12 million and $6 million for the six months ended December 31, 2006
and 2005, respectively.
During the second quarter of 2006, MetLife’s ownership interests in Tribeca declined to a position whereby Tribeca is no longer
consolidated and, as of June 30, 2006, was accounted for under the equity method of accounting. The equity method investment at
December 31, 2006 of $82 million was included in other limited partnership interests. Net investment income related to the Company’s
equity method investment in Tribeca was $9 million for the six months ended December 31, 2006.
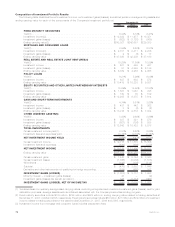
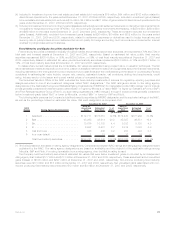
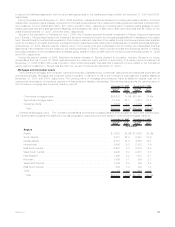
Mortgage and Consumer Loans
The Company’s mortgage and consumer loans are principally collateralized by commercial, agricultural and residential properties, as
well as automobiles. Mortgage and consumer loans comprised 13.6% and 12.7% of the Company’s total cash and invested assets at
December 31, 2007 and 2006, respectively. The carrying value of mortgage and consumer loans is stated at original cost net of
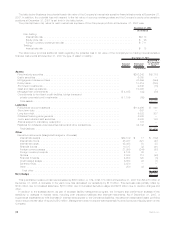
repayments, amortization of premiums, accretion of discounts and valuation allowances. The following table shows the carrying value of
the Company’s mortgage and consumer loans by type at:
Carrying
Value %of
Tot al Carrying
Value %of
Tot al
December 31, 2007 December 31, 2006
(In millions)
Commercialmortgageloans .................................. $35,501 75.5% $31,847 75.4%
Agriculturalmortgageloans................................... 10,484 22.3 9,213 21.8
Consumerloans.......................................... 1,045 2.2 1,179 2.8
Total . . . . . . . . . . . . . . . . . . . . . . . . . . . . . . . . . . . . . . . . . . . . . . . . $47,030 100.0% $42,239 100.0%
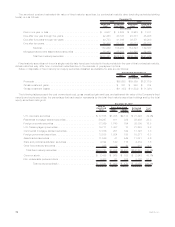
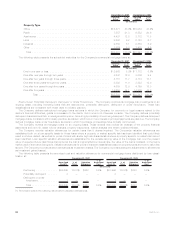
Commercial Mortgage Loans. The Company diversifies its commercial mortgage loans by both geographic region and property type.
The following table presents the distribution across geographic regions and property types for commercial mortgage loans at:
Carrying
Value %of
Tot al Carrying
Value %of
Tot al
December 31, 2007 December 31, 2006
(In millions)
Region
Pacific ................................................ $ 8,620 24.3% $ 7,663 24.0%
SouthAtlantic............................................ 8,021 22.6 6,881 21.6
MiddleAtlantic ........................................... 5,110 14.4 4,858 15.3
International............................................. 3,642 10.3 2,832 8.9
EastNorthCentral......................................... 2,957 8.3 2,879 9.0
WestSouthCentral........................................ 2,925 8.2 2,631 8.3
NewEngland ............................................ 1,499 4.2 1,301 4.1
Mountain............................................... 1,086 3.1 859 2.7
WestNorthCentral ........................................ 1,046 2.9 799 2.5
EastSouthCentral ........................................ 503 1.4 452 1.4
Other ................................................. 92 0.3 692 2.2
Total . . . . . . . . . . . . . . . . . . . . . . . . . . . . . . . . . . . . . . . . . . . . . . . . $35,501 100.0% $31,847 100.0%
79MetLife, Inc.