Reebok 2012 Annual Report Download - page 94
Download and view the complete annual report
Please find page 94 of the 2012 Reebok annual report below. You can navigate through the pages in the report by either clicking on the pages listed below, or by using the keyword search tool below to find specific information within the annual report.-
 1
1 -
2
-
3
-
4
-
5
-
6
-
7
-
8
-
9
-
10
-
11
-
12
-
13
-
14
-
15
-
16
-
17
-
18
-
19
-
20
-
21
-
22
-
23
-
24
-
25
-
26
-
27
-
28
-
29
-
30
-
31
-
32
-
33
-
34
-
35
-
36
-
37
-
38
-
39
-
40
-
41
-
42
-
43
-
44
-
45
-
46
-
47
-
48
-
49
-
50
-
51
-
52
-
53
-
54
-
55
-
56
-
57
-
58
-
59
-
60
-
61
-
62
-
63
-
64
-
65
-
66
-
67
-
68
-
69
-
70
-
71
-
72
-
73
-
74
-
75
-
76
-
77
-
78
-
79
-
80
-
81
-
82
-
83
-
 84
84 -
 85
85 -
 86
86 -
 87
87 -
 88
88 -
 89
89 -
 90
90 -
 91
91 -
 92
92 -
 93
93 -
 94
94 -
 95
95 -
 96
96 -
 97
97 -
 98
98 -
 99
99 -
 100
100 -
 101
101 -
 102
102 -
 103
103 -
 104
104 -
105
-
106
-
107
-
108
-
109
-
110
-
111
-
112
-
113
-
114
-
115
-
116
-
117
-
118
-
119
-
120
-
121
-
122
-
123
-
124
-
125
-
126
-
127
-
128
-
129
-
130
-
131
-
132
-
133
-
134
-
135
-
136
-
137
-
138
-
139
-
140
-
141
-
142
-
143
-
144
-
145
-
146
-
147
-
148
-
149
-
150
-
151
-
152
-
153
-
154
-
155
-
156
-
157
-
158
-
159
-
160
-
161
-
162
-
163
-
164
-
165
-
166
-
167
-
168
-
169
-
170
-
171
-
172
-
173
-
174
-
175
-
176
-
177
-
178
-
179
-
180
-
181
-
182
-
183
-
184
-
185
-
186
-
187
-
188
-
189
-
190
-
191
-
192
-
193
-
194
-
195
-
196
-
197
-
198
-
199
-
200
-
201
-
202
-
203
-
204
-
205
-
206
-
207
-
208
-
209
-
210
-
211
-
212
-
213
-
214
-
215
-
216
-
217
-
218
-
219
-
220
-
221
-
222
-
223
-
224
-
225
-
226
-
227
-
228
-
229
-
230
-
231
-
232
-
233
-
234
-
235
-
236
-
237
-
238
-
239
-
240
-
241
-
242
-
243
-
244
-
245
-
246
-
247
-
248
-
249
-
250
-
251
-
252
-
253
-
254
-
255
-
256
-
257
-
258
-
259
-
260
-
261
-
262
-
263
-
264
-
265
-
266
-
267
-
268
-
269
-
270
-
271
-
272
-
273
-
274
-
275
-
276
-
277
-
278
-
279
-
280
-
281
-
282
 |
 |

2
adidas Group
/
2012 Annual Report
Group Management Report – Our Group
72
2012
Global Sales Strategy
/
02.2
/
Global Sales Strategy
The Global Sales function is responsible for the commercial activities of the adidas and Reebok brands.
The function is organised in three distinctive channels – Wholesale, Retail and eCommerce. By catering
to these three business models, the Group aims to service multiple customer and consumer needs
in order to fully leverage brand potential, be more responsive to market developments and manage
channel synergies by establishing best practices worldwide.
Global Sales defines strategic priorities until 2015
The Global Sales function directs all local market organisations respon-
sible for the distribution of the adidas and Reebok brands. The key priority
of Global Sales is to design and implement state-of-the-art commercial
strategies that ultimately engage consumers with rewarding point-of-
sale experiences.
As part of our strategic business plan Route 2015, the Global Sales
function has defined three strategic priorities:
/
Increase the share of controlled space to over 50% of Group sales by
2015.
/
Implement an Integrated Distribution Roadmap to ensure further
growth and maximise brand potential in key demographic locations.
/
Leverage cross-channel sales opportunities and range efficiencies.
The Global Sales function has identified North America, Greater
China, Russia/CIS, Latin America, Japan and the UK as key growth
markets
/
SEE GROUP STRATEGY, P. 68. Of these markets, the three attack
markets North America, Greater China and Russia/CIS are targeted to
contribute around 50% of the sales increase we anticipate as part of
Route 2015.
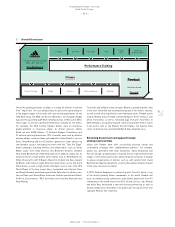
Focus on controlled space
Our brands must be competitive at the point of sale, based on avail-
ability, convenience and breadth of product offering. As a result, we are
continuously refining our distribution proposition with a strong focus on
controlled space.
Controlled space includes:
/
Own retail
/
eCommerce
/
Mono-branded franchise stores
/
Shop-in-shops
/
Joint ventures with retail partners
/
Co-branded stores with sports organisations and other brands.
These formats provide us with a high level of brand control as we either
manage the stores ourselves (i.e. Retail and eCommerce) or we work
closely with our wholesale partners (e.g. for mono-branded franchise
stores, shop-in-shops, joint ventures and co-branded stores) to ensure
the appropriate product offering and presentation at the point of sale. We
intend to increase our controlled space initiatives to over 50% of Group
sales by 2015 (2012: 45%). This will mainly be driven by growth in our
Retail segment and the expansion of our own store base as well as by
growth initiatives within our Wholesale segment, such as the expansion
of our franchise business.
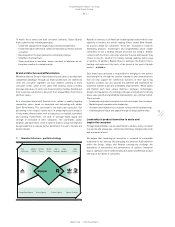
Integrated Distribution Roadmap to increase brand
presence and market share
In order to increase our global brand presence and ensure further
growth of our business, our Global Sales function has set up a compre-
hensive initiative called “Integrated Distribution Roadmap” (IDR). The
initiative encompasses a joint approach between our three channels,
allowing us to define how best to capture the consumer in the biggest
and most attractive cities around the world without cannibalising our
brands and distribution mix. The roadmap is designed to ensure market
share growth in underpenetrated affluent metropolitan areas such as
New York City, where the IDR has helped us to clearly map out several
potential new locations for increasing our brands’ presence, which we
are now beginning to execute upon.
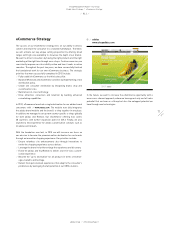
Online multi-channel growth toolkit
The online sales opportunity for our Group is enormous and has accel-
erated faster than previously expected. It includes sales through our
own eCommerce channel as well as through our Wholesale channel (i.e.
through online platforms of our Wholesale customers). In 2012, Global
Sales introduced the online multi-channel growth toolkit. The purpose of
this toolkit is to support the growth potential and sales ambition across
Wholesale and eCommerce. Ultimately, we are aiming towards the
global alignment of our online activities across our sales channels and
different geographies to achieve higher speed, more consistency and
increased consumer focus.
Increasing range consistency globally
In 2011, as part of a joint initiative between the Global Sales and Global
Brands functions, we defined a “Global Foundation Range” (GFR), which
represents a set of products that must be sold through all our sales
channels globally. This range continues to mature as additional products
are added and its commercial performance exceeds that of non-GFR
products. We will continue to develop the GFR in 2013 to increase the
commonality of products displayed throughout our concept stores and to
drive their commercial performance, e.g. full-price sell-through.