Reebok 2012 Annual Report Download - page 175
Download and view the complete annual report
Please find page 175 of the 2012 Reebok annual report below. You can navigate through the pages in the report by either clicking on the pages listed below, or by using the keyword search tool below to find specific information within the annual report.-
 1
1 -
2
-
3
-
4
-
5
-
6
-
7
-
8
-
9
-
10
-
11
-
12
-
13
-
14
-
15
-
16
-
17
-
18
-
19
-
20
-
21
-
22
-
23
-
24
-
25
-
26
-
27
-
28
-
29
-
30
-
31
-
32
-
33
-
34
-
35
-
36
-
37
-
38
-
39
-
40
-
41
-
42
-
43
-
44
-
45
-
46
-
47
-
48
-
49
-
50
-
51
-
52
-
53
-
54
-
55
-
56
-
57
-
58
-
59
-
60
-
61
-
62
-
63
-
64
-
65
-
66
-
67
-
68
-
69
-
70
-
71
-
72
-
73
-
74
-
75
-
76
-
77
-
78
-
79
-
80
-
81
-
82
-
83
-
84
-
85
-
86
-
87
-
88
-
89
-
90
-
91
-
92
-
93
-
94
-
95
-
96
-
97
-
98
-
99
-
100
-
101
-
102
-
103
-
104
-
105
-
106
-
107
-
108
-
109
-
110
-
111
-
112
-
113
-
114
-
115
-
116
-
117
-
118
-
119
-
120
-
121
-
122
-
123
-
124
-
125
-
126
-
127
-
128
-
129
-
130
-
131
-
132
-
133
-
134
-
135
-
136
-
137
-
138
-
139
-
140
-
141
-
142
-
143
-
144
-
145
-
146
-
147
-
148
-
149
-
150
-
151
-
152
-
153
-
154
-
155
-
156
-
157
-
158
-
159
-
160
-
161
-
162
-
163
-
164
-
 165
165 -
 166
166 -
 167
167 -
 168
168 -
 169
169 -
 170
170 -
 171
171 -
 172
172 -
 173
173 -
 174
174 -
 175
175 -
 176
176 -
 177
177 -
 178
178 -
 179
179 -
 180
180 -
 181
181 -
 182
182 -
 183
183 -
 184
184 -
 185
185 -
186
-
187
-
188
-
189
-
190
-
191
-
192
-
193
-
194
-
195
-
196
-
197
-
198
-
199
-
200
-
201
-
202
-
203
-
204
-
205
-
206
-
207
-
208
-
209
-
210
-
211
-
212
-
213
-
214
-
215
-
216
-
217
-
218
-
219
-
220
-
221
-
222
-
223
-
224
-
225
-
226
-
227
-
228
-
229
-
230
-
231
-
232
-
233
-
234
-
235
-
236
-
237
-
238
-
239
-
240
-
241
-
242
-
243
-
244
-
245
-
246
-
247
-
248
-
249
-
250
-
251
-
252
-
253
-
254
-
255
-
256
-
257
-
258
-
259
-
260
-
261
-
262
-
263
-
264
-
265
-
266
-
267
-
268
-
269
-
270
-
271
-
272
-
273
-
274
-
275
-
276
-
277
-
278
-
279
-
280
-
281
-
282
 |
 |
adidas Group
/
2012 Annual Report
Group Management Report – Financial Review
153
2012
/
03.3
/
Business Performance by Segment
/
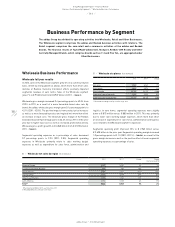
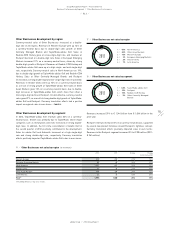
Retail Business Performance
11
/
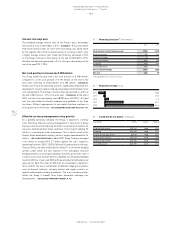
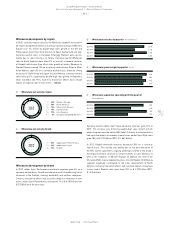
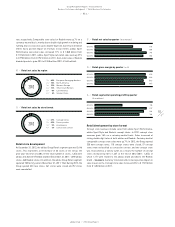
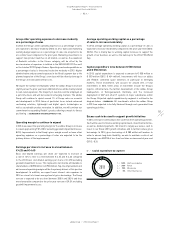
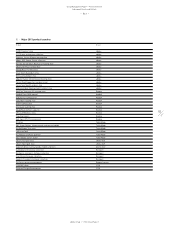
Retail net sales by store format
1
/
47% Concept stores
2
/
45% Factory outlets
3
/
5% eCommerce
4
/
3% Concession corners
10
/
Retail net sales by region
1
/
40% European Emerging Markets
2
/
18% North America
3
/
15% Western Europe
4
/
13% Other Asian Markets
5
/
8% Latin America
6
/
6% Greater China
2012 1
2
3 4
2012
6
5
1
2
3
4
12
/
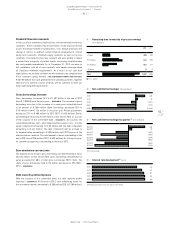
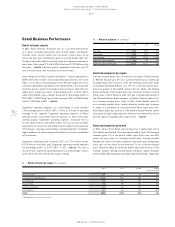
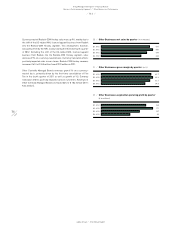
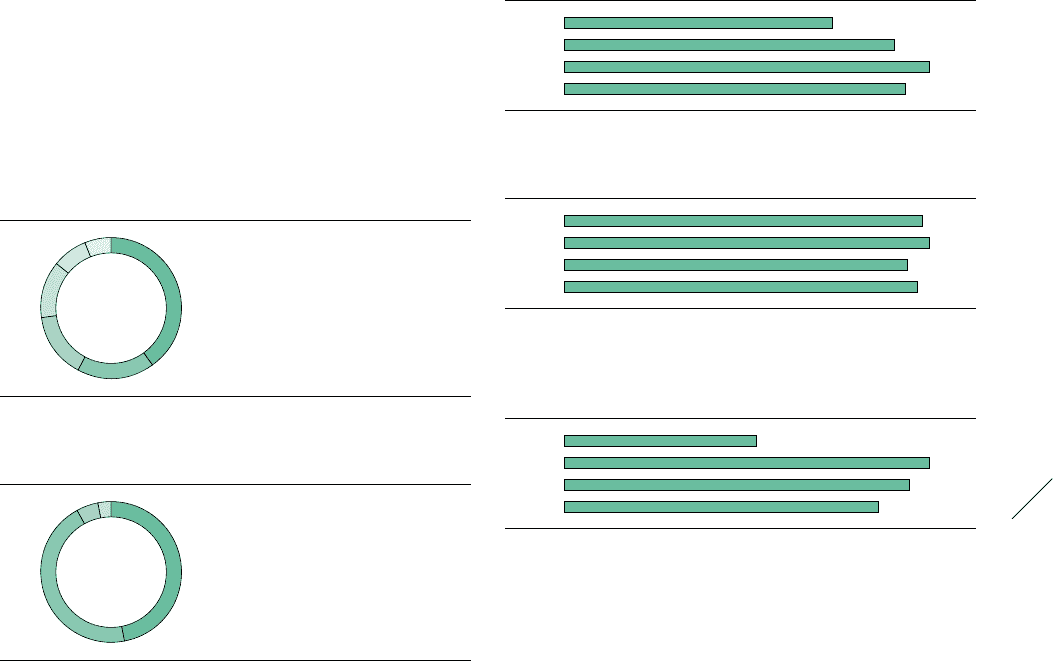
Retail net sales by quarter (€ in millions)
Q1 2012 693
Q2 2012 854
Q3 2012 944
Q4 2012 882
14
/
Retail segmental operating profit by quarter
(€ in millions)
Q1 2012 115
Q2 2012 217
Q3 2012 206
Q4 2012 186
13
/
Retail gross margin by quarter (in %)
Q1 2012 61.5
Q2 2012 62.8
Q3 2012 59.0
Q4 2012 60.7
rate, respectively. Comparable store sales for Reebok were up 7% on a
currency-neutral basis, mainly due to double-digit growth in training and
running. Classics was also up at a double-digit rate. Currency translation
effects had a positive impact on revenues in euro terms. adidas Sport
Performance own-retail sales increased 17% to € 1.848 billion from
€ 1.576 billion in 2011. adidas Sport Style own-retail sales were up 27%
to € 958 million from € 752 million in 2011. Own-retail sales of Reebok
branded products grew 20% to € 558 million (2011: € 463 million).
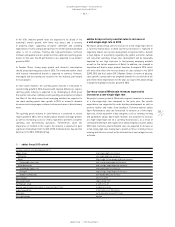
Retail store development
At December 31, 2012, the adidas Group Retail segment operated 2,446
stores. This represents a net increase of 62 stores or 3% versus the
prior year-end level of 2,384. Of the total number of stores, 1,353 were
adidas and 363 were Reebok branded (December 31, 2011: 1,290 adidas
stores, 360 Reebok stores). In addition, the adidas Group Retail segment
operated 730 factory outlets (December 31, 2011: 734). During 2012, the
Group opened 323 new stores, 261 stores were closed and 92 stores
were remodelled.
Retail development by store format
Concept store revenues include sales from adidas Sport Performance,
adidas Sport Style and Reebok concept stores. In 2012, concept store
revenues grew 16% on a currency-neutral basis. Sales increased at
strong double-digit rates at both adidas and Reebok. Currency-neutral
comparable concept store sales were up 7%. In 2012, the Group opened
250 new concept stores, 110 concept stores were closed, 57 concept
stores were reclassified as concession corners, and one concept store
was reclassified as a factory outlet. As a result, the number of concept
stores increased by 82 to 1,437 at the end of 2012 (2011: 1,355), of
which 1,171 were related to the adidas brand and 266 to the Reebok
brand
/
DIAGRAM 15. Currency translation effects had a positive impact on
sales in euro terms. Concept store sales increased 23% to € 1.572 billion
from € 1.282 billion in 2011.