Reebok 2012 Annual Report Download - page 5
Download and view the complete annual report
Please find page 5 of the 2012 Reebok annual report below. You can navigate through the pages in the report by either clicking on the pages listed below, or by using the keyword search tool below to find specific information within the annual report.-
 1
1 -
 2
2 -
 3
3 -
 4
4 -
 5
5 -
 6
6 -
 7
7 -
 8
8 -
 9
9 -
 10
10 -
 11
11 -
 12
12 -
 13
13 -
 14
14 -
 15
15 -
 16
16 -
17
-
18
-
19
-
20
-
21
-
22
-
23
-
24
-
25
-
26
-
27
-
28
-
29
-
30
-
31
-
32
-
33
-
34
-
35
-
36
-
37
-
38
-
39
-
40
-
41
-
42
-
43
-
44
-
45
-
46
-
47
-
48
-
49
-
50
-
51
-
52
-
53
-
54
-
55
-
56
-
57
-
58
-
59
-
60
-
61
-
62
-
63
-
64
-
65
-
66
-
67
-
68
-
69
-
70
-
71
-
72
-
73
-
74
-
75
-
76
-
77
-
78
-
79
-
80
-
81
-
82
-
83
-
84
-
85
-
86
-
87
-
88
-
89
-
90
-
91
-
92
-
93
-
94
-
95
-
96
-
97
-
98
-
99
-
100
-
101
-
102
-
103
-
104
-
105
-
106
-
107
-
108
-
109
-
110
-
111
-
112
-
113
-
114
-
115
-
116
-
117
-
118
-
119
-
120
-
121
-
122
-
123
-
124
-
125
-
126
-
127
-
128
-
129
-
130
-
131
-
132
-
133
-
134
-
135
-
136
-
137
-
138
-
139
-
140
-
141
-
142
-
143
-
144
-
145
-
146
-
147
-
148
-
149
-
150
-
151
-
152
-
153
-
154
-
155
-
156
-
157
-
158
-
159
-
160
-
161
-
162
-
163
-
164
-
165
-
166
-
167
-
168
-
169
-
170
-
171
-
172
-
173
-
174
-
175
-
176
-
177
-
178
-
179
-
180
-
181
-
182
-
183
-
184
-
185
-
186
-
187
-
188
-
189
-
190
-
191
-
192
-
193
-
194
-
195
-
196
-
197
-
198
-
199
-
200
-
201
-
202
-
203
-
204
-
205
-
206
-
207
-
208
-
209
-
210
-
211
-
212
-
213
-
214
-
215
-
216
-
217
-
218
-
219
-
220
-
221
-
222
-
223
-
224
-
225
-
226
-
227
-
228
-
229
-
230
-
231
-
232
-
233
-
234
-
235
-
236
-
237
-
238
-
239
-
240
-
241
-
242
-
243
-
244
-
245
-
246
-
247
-
248
-
249
-
250
-
251
-
252
-
253
-
254
-
255
-
256
-
257
-
258
-
259
-
260
-
261
-
262
-
263
-
264
-
265
-
266
-
267
-
268
-
269
-
270
-
271
-
272
-
273
-
274
-
275
-
276
-
277
-
278
-
279
-
280
-
281
-
282
 |
 |
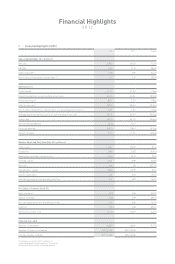
Financial Highlights
2012
1) Restated according to IAS 8, see Note 03.
2) Excluding goodwill impairment of € 265 million.
3) Subject to Annual General Meeting approval.
01
/
Financial Highlights (IFRS)
2012 2011 1) Change
Operating Highlights (€ in millions)
Net sales 14,883 13,322 11.7%
EBITDA 1,445 1,199 20.6%
Operating profit 2) 1,185 953 24.4%
Net income attributable to shareholders 2) 791 613 29.0%
Key Ratios (%)
Gross margin 47.7% 47.5% 0.2pp
Operating expenses as a percentage of net sales 41.3% 41.8% (0.5pp)
Operating margin 2) 8.0% 7.2% 0.8pp
Effective tax rate 2) 29.3% 30.0% (0.7pp)
Net income attributable to shareholders as a percentage of net sales 2) 5.3% 4.6% 0.7pp
Average operating working capital as a percentage of net sales 20.0% 20.4% (0.4pp)
Equity ratio 45.5% 45.7% (0.2pp)
Net borrowings/EBITDA (0.3) (0.1)
Financial leverage (8.5%) (1.8%) (6.7pp)
Return on equity 9.9% 11.9% (2.0pp)
Balance Sheet and Cash Flow Data (€ in millions)
Total assets 11,651 11,237 3.7%
Inventories 2,486 2,502 (0.6%)
Receivables and other current assets 2,444 2,431 0.5%
Working capital 2,504 1,990 25.8%
Net cash 448 90 397.7%
Shareholders’ equity 5,304 5,137 3.3%
Capital expenditure 434 376 15.4%
Net cash generated from operating activities 942 807 16.7%
Per Share of Common Stock (€)
Basic earnings 2) 3.78 2.93 29.0%
Diluted earnings 2) 3.78 2.93 29.0%
Net cash generated from operating activities 4.50 3.86 16.7%
Dividend 1.35 3) 1.00 35.0%
Share price at year-end 67.33 50.26 34.0%
Other (at year-end)
Number of employees 46,306 46,824 (1.1%)
Number of shares outstanding 209,216,186 209,216,186 –
Average number of shares 209,216,186 209,216,186 –