Reebok 2012 Annual Report Download - page 241
Download and view the complete annual report
Please find page 241 of the 2012 Reebok annual report below. You can navigate through the pages in the report by either clicking on the pages listed below, or by using the keyword search tool below to find specific information within the annual report.-
 1
1 -
2
-
3
-
4
-
5
-
6
-
7
-
8
-
9
-
10
-
11
-
12
-
13
-
14
-
15
-
16
-
17
-
18
-
19
-
20
-
21
-
22
-
23
-
24
-
25
-
26
-
27
-
28
-
29
-
30
-
31
-
32
-
33
-
34
-
35
-
36
-
37
-
38
-
39
-
40
-
41
-
42
-
43
-
44
-
45
-
46
-
47
-
48
-
49
-
50
-
51
-
52
-
53
-
54
-
55
-
56
-
57
-
58
-
59
-
60
-
61
-
62
-
63
-
64
-
65
-
66
-
67
-
68
-
69
-
70
-
71
-
72
-
73
-
74
-
75
-
76
-
77
-
78
-
79
-
80
-
81
-
82
-
83
-
84
-
85
-
86
-
87
-
88
-
89
-
90
-
91
-
92
-
93
-
94
-
95
-
96
-
97
-
98
-
99
-
100
-
101
-
102
-
103
-
104
-
105
-
106
-
107
-
108
-
109
-
110
-
111
-
112
-
113
-
114
-
115
-
116
-
117
-
118
-
119
-
120
-
121
-
122
-
123
-
124
-
125
-
126
-
127
-
128
-
129
-
130
-
131
-
132
-
133
-
134
-
135
-
136
-
137
-
138
-
139
-
140
-
141
-
142
-
143
-
144
-
145
-
146
-
147
-
148
-
149
-
150
-
151
-
152
-
153
-
154
-
155
-
156
-
157
-
158
-
159
-
160
-
161
-
162
-
163
-
164
-
165
-
166
-
167
-
168
-
169
-
170
-
171
-
172
-
173
-
174
-
175
-
176
-
177
-
178
-
179
-
180
-
181
-
182
-
183
-
184
-
185
-
186
-
187
-
188
-
189
-
190
-
191
-
192
-
193
-
194
-
195
-
196
-
197
-
198
-
199
-
200
-
201
-
202
-
203
-
204
-
205
-
206
-
207
-
208
-
209
-
210
-
211
-
212
-
213
-
214
-
215
-
216
-
217
-
218
-
219
-
220
-
221
-
222
-
223
-
224
-
225
-
226
-
227
-
228
-
229
-
230
-
 231
231 -
 232
232 -
 233
233 -
 234
234 -
 235
235 -
 236
236 -
 237
237 -
 238
238 -
 239
239 -
 240
240 -
 241
241 -
 242
242 -
 243
243 -
 244
244 -
 245
245 -
 246
246 -
 247
247 -
 248
248 -
 249
249 -
 250
250 -
 251
251 -
252
-
253
-
254
-
255
-
256
-
257
-
258
-
259
-
260
-
261
-
262
-
263
-
264
-
265
-
266
-
267
-
268
-
269
-
270
-
271
-
272
-
273
-
274
-
275
-
276
-
277
-
278
-
279
-
280
-
281
-
282
 |
 |

adidas Group
/
2012 Annual Report
Consolidated Financial Statements
219
2012
/
04.8
/
Notes
/
Notes to the Consolidated Statement of Financial Position
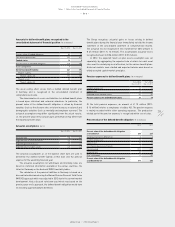
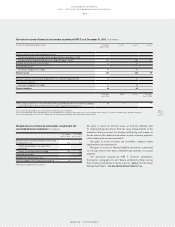
Amounts for defined benefit plans recognised in the
consolidated statement of financial position (€ in millions)
Dec. 31, 2012 Dec. 31, 2011
Present value of funded obligation 89 76
Fair value of plan assets (76) (67)
Funded status 13 9
Present value of unfunded obligation 228 184
Asset ceiling effect 0 1
Net defined benefit liability 241 194
Thereof: liability 241 195
Thereof: adidas AG 196 154
Thereof: asset (0) (1)
Thereof: adidas AG – (1)
The asset ceiling effect arises from a funded defined benefit plan
in Germany and is recognised in the consolidated statement of
comprehensive income.
The determination of assets and liabilities for defined benefit plans
is based upon statistical and actuarial valuations. In particular, the
present value of the defined benefit obligation is driven by financial
variables (such as the discount rates or future increases in salaries) and
demographic variables (such as mortality and employee turnover). The
actuarial assumptions may differ significantly from the actual results,
i.e. the present value of the actual future performance may differ from
the reported present value.
Actuarial assumptions (in %)
Dec. 31, 2012 Dec. 31, 2011
Discount rate 3.5 4.3
Expected rate of salary increases 3.2 3.3
Expected pension increases 2.1 2.1
Expected return on plan assets 4.0 4.8
The actuarial assumptions as at the balance sheet date are used to
determine the defined benefit liability at that date and the pension
expense for the upcoming financial year.
The actuarial assumptions for withdrawal and mortality rates are
based on statistical information available in the various countries, the
latter for Germany on the Heubeck 2005 G mortality tables.
The calculation of the pension liabilities in Germany is based on a
discount rate determined using the Mercer Pension Discount Yield Curve
(MPDYC) approach which was adjusted in 2012 due to the current market
development. Had a discount rate been used which was based on the
previous year-end’s approach, the defined benefit obligation would have
increased by approximately € 20 million.
The Group recognises actuarial gains or losses arising in defined
benefit plans during the financial year immediately outside the income
statement in the consolidated statement of comprehensive income.
The actuarial losses recognised in this statement for 2012 amount to
€ 35 million (2011: € 13 million). The accumulated actuarial losses
recognised amount to € 86 million (2011: € 51 million).
In 2012, the expected return on plan assets assumption was set
separately, by aggregating the expected rate of return for each asset
class over the underlying asset allocation, for the various benefit plans.
Historical markets were studied and expected returns were based on
widely accepted capital market principles.
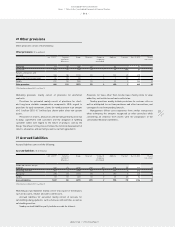
Pension expenses for defined benefit plans (€ in millions)
Year ending
Dec. 31, 2012
Year ending
Dec. 31, 2011
Current service cost 16 12
Interest cost 11 11
Expected return on plan assets (3) (4)
Pension expenses for defined benefit plans 24 19
Of the total pension expenses, an amount of € 15 million (2011:
€ 13 million) relates to employees of adidas AG. The pension expense
is mainly recorded within other operating expenses. The production-
related part of the pension expenses is recognised within cost of sales.
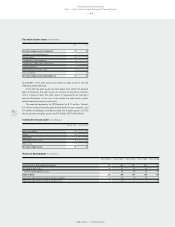
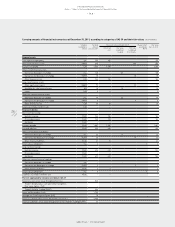
Present value of the defined benefit obligation (€ in millions)
2012 2011
Present value of the defined benefit obligation
as at January 1 260 237
Currency translation differences 2 3
Current service cost 16 12
Interest cost 11 11
Contribution by plan participants 0 0
Pensions paid (11) (10)
Actuarial loss 39 10
Plan settlements 0 (3)
Present value of the defined benefit obligation
as at December 31 317 260